
Solution · Capacity Planning
Less food waste, better quantity planning
Kibi Scada shows where overproduction systematically occurs and provides the data basis for concrete adjustments in portion planning.
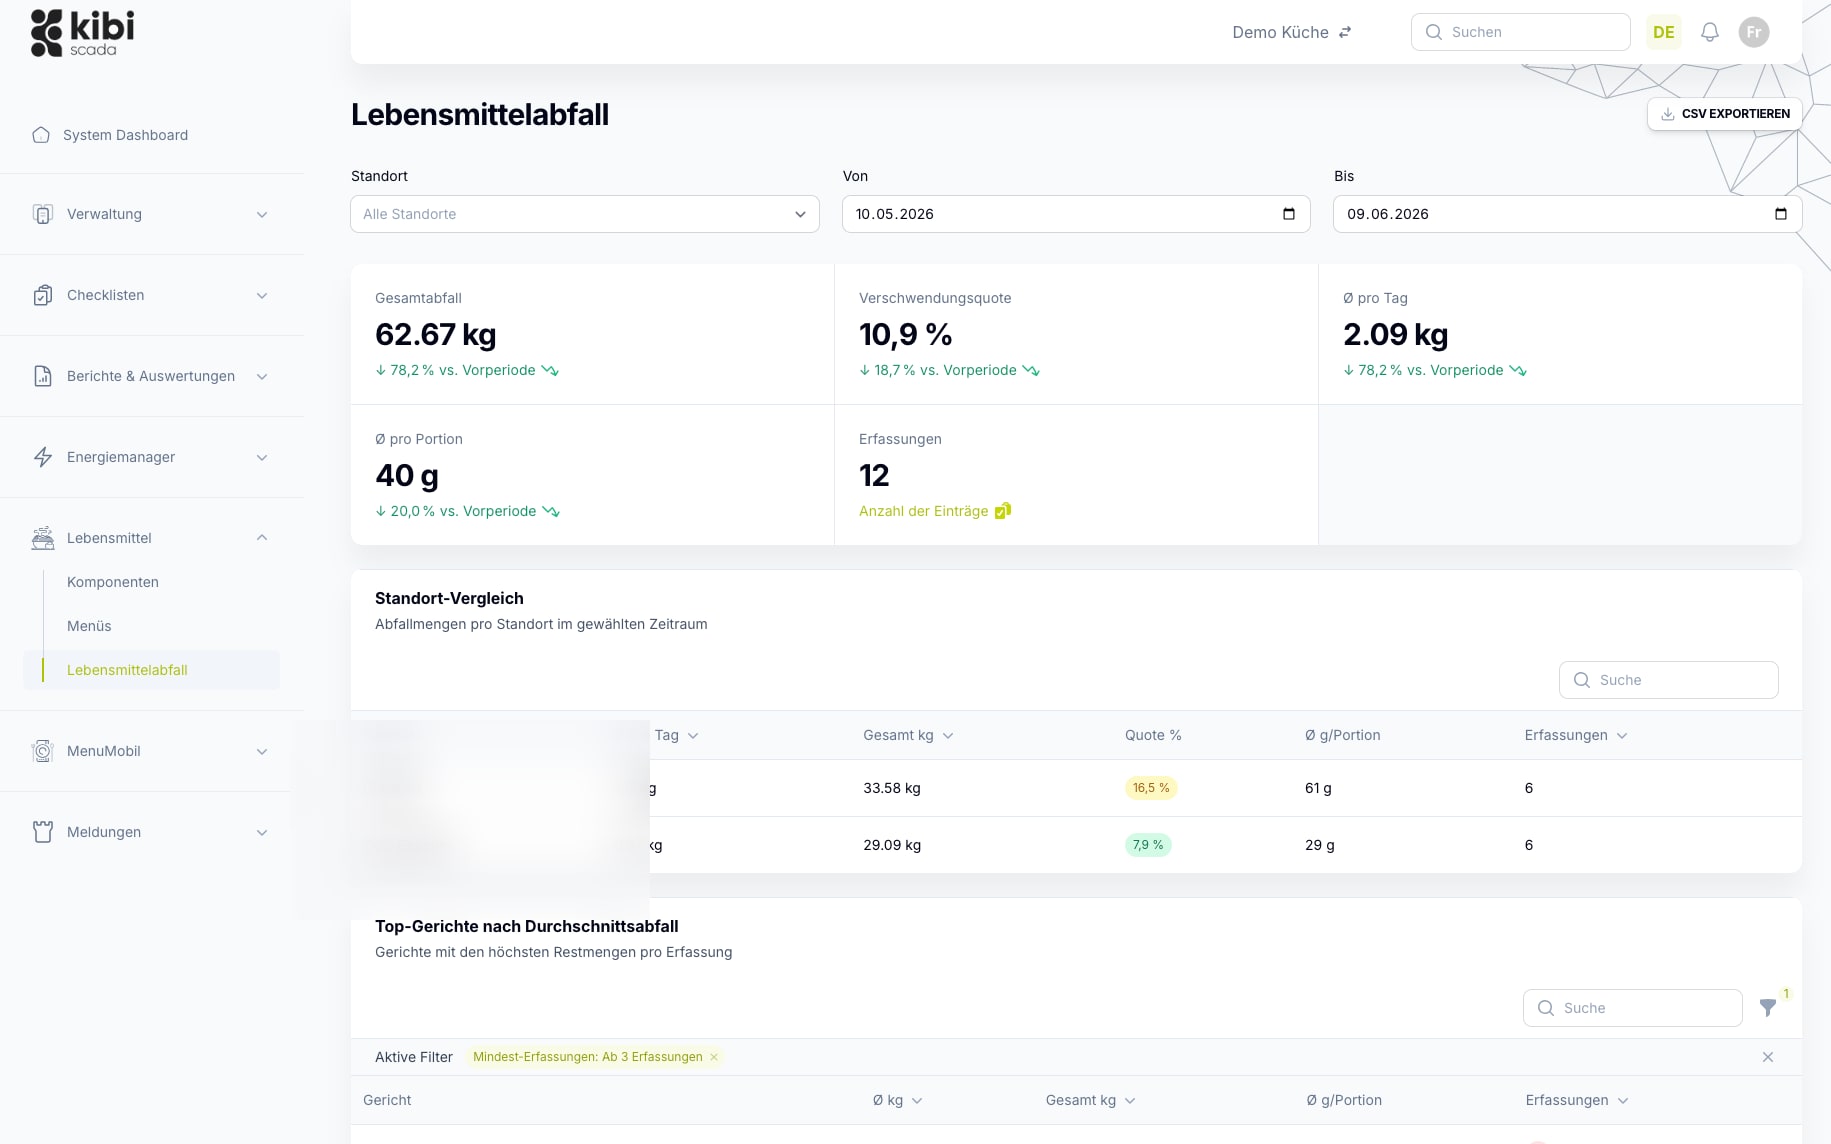
Capture components and menus in a structured way – quantities and leftovers per item
Compare waste by component, menu, day, and location
Measure reduction effects and export for sustainability reports
Ausgangslage
Why food waste often remains a gut feeling rather than a management issue
Food waste is visible, but rarely structured in a way that teams can derive actionable measures from it. This is exactly the gap our solution addresses.
Remaining quantities are observed, but not systematically understood.
At the end of the day, one thing is clear: something is left over. What often remains unclear is which component, which menu, or which location actually caused the discrepancy.
Production and planning are learning from each other too slowly.
When leftover quantities are only roughly or irregularly recorded, it’s nearly impossible to refine meal plans and portion sizes in a targeted way.
Sustainability goals remain communicative rather than measurable
Less waste is often demanded but rarely documented cleanly. Without reliable data, food waste remains more of an image topic than an operational lever.
Lösung durch Kibi Scada
How Kibi Scada Turns Food Waste into an Operational Improvement Opportunity
The solution integrates data collection, analysis, and reporting in a way that enables not just documentation of surplus quantities, but their actual reduction.
Causes are displayed per component and menu
Kibi Scada transforms rough remaining quantities into a detailed view of ingredients, locations, and time periods. This makes food waste a tangible issue to address.
Test planning decisions for impact
Changes to menus, quantities, or portion logic don’t get lost in gut feeling—they can be evaluated through before-and-after comparisons.
Reduction becomes measurable for management and reporting
Food waste data becomes the foundation for sustainability reports and internal improvement processes. This creates impact with proof, not just promises.
Ablauf im Betrieb
How the solution is used in everyday kitchen operations
From master data to recording and evaluation, Food Waste Analytics runs as a repeatable process. This makes improvements measurable over time.
Phase 01
01Create components and menus
Meals and their components, as well as the menus created from them, are stored in the system—including planned quantities.
Phase 02
02Track production and leftovers
Production and output quantities per component are recorded throughout the daily workflow – the difference gives you the remaining quantity.
Phase 03
03Analyze and reduce
The Food Waste Analytics Dashboard highlights hotspots: which components and menus regularly result in leftovers—providing the basis for targeted adjustments.
Passende Bausteine
Which Kibi Scada modules support this solution?
Food Waste Analytics thrives on visibility, evaluation, and clean data flow. These building blocks power the solution within the platform.
Dashboard
Keep track of volumes, hotspots, and trends—all visible in one platform for teams and management.
Funktion ansehenReporting
Emission reduction proofs and site comparisons can be exported as reliable reports.
Funktion ansehenIntegrations
Capture and context data can be integrated with existing processes and systems.
Funktion ansehenTypische Einsatzbilder
Where Food Waste Analytics Delivers the Biggest Impact
Wherever menus, quantities, and serving situations vary, a solution that clearly tracks leftovers by cause—not just by total volume—makes all the difference.
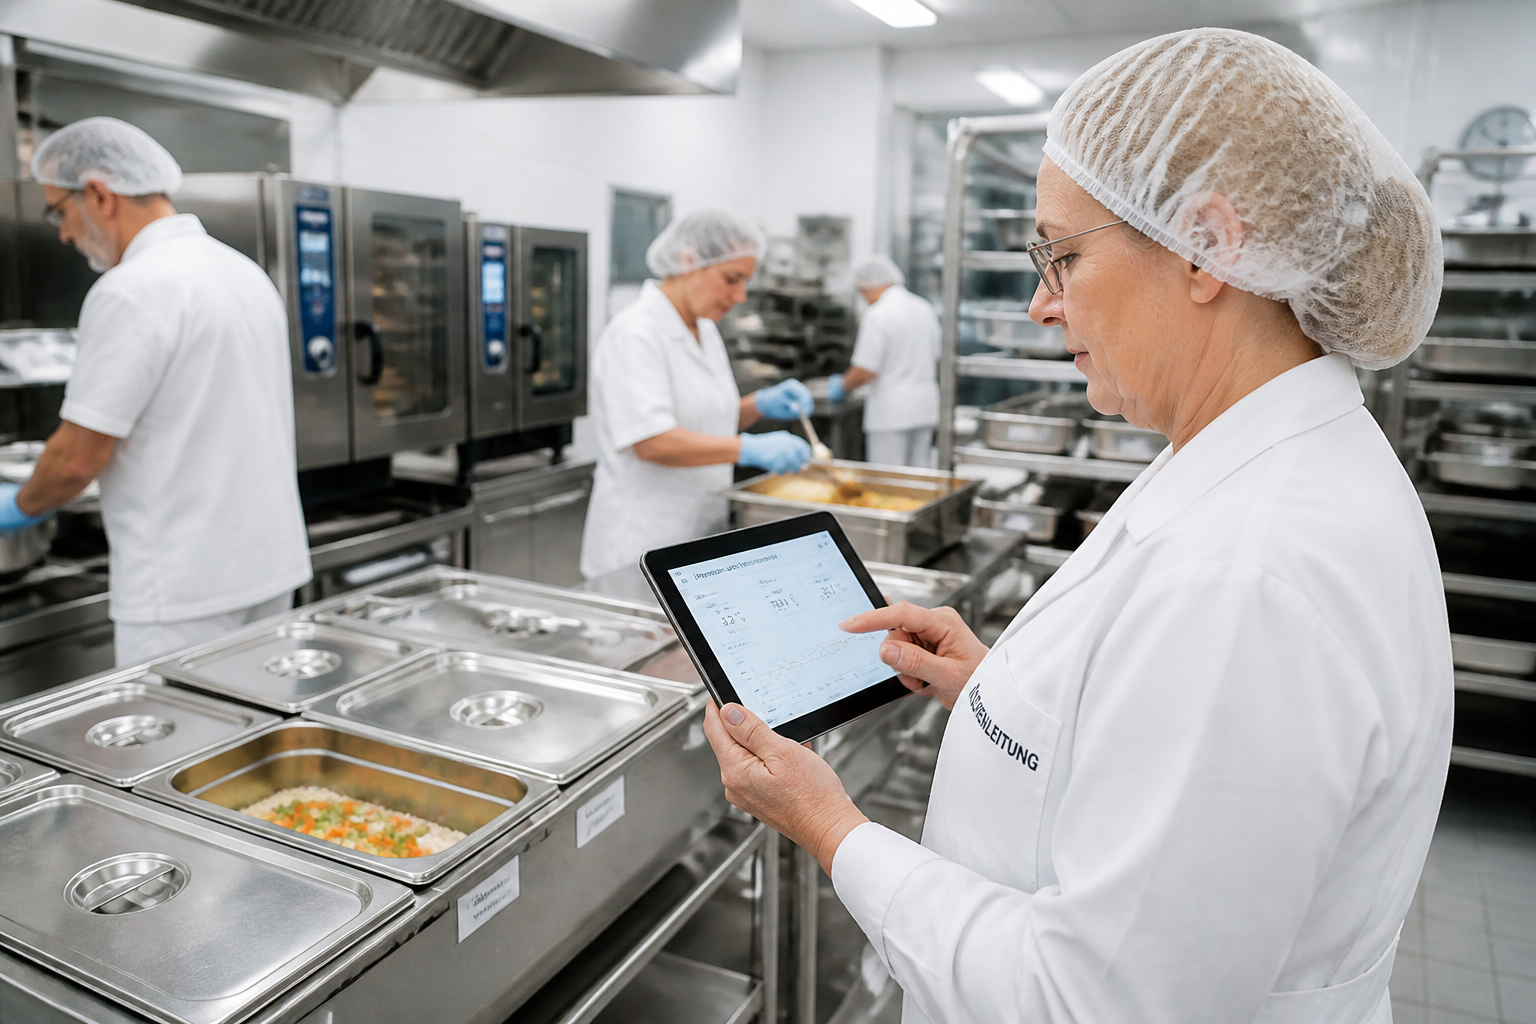
Hospitals
Remaining quantities per station and patient cluster visible – the basis for customized meal planning.
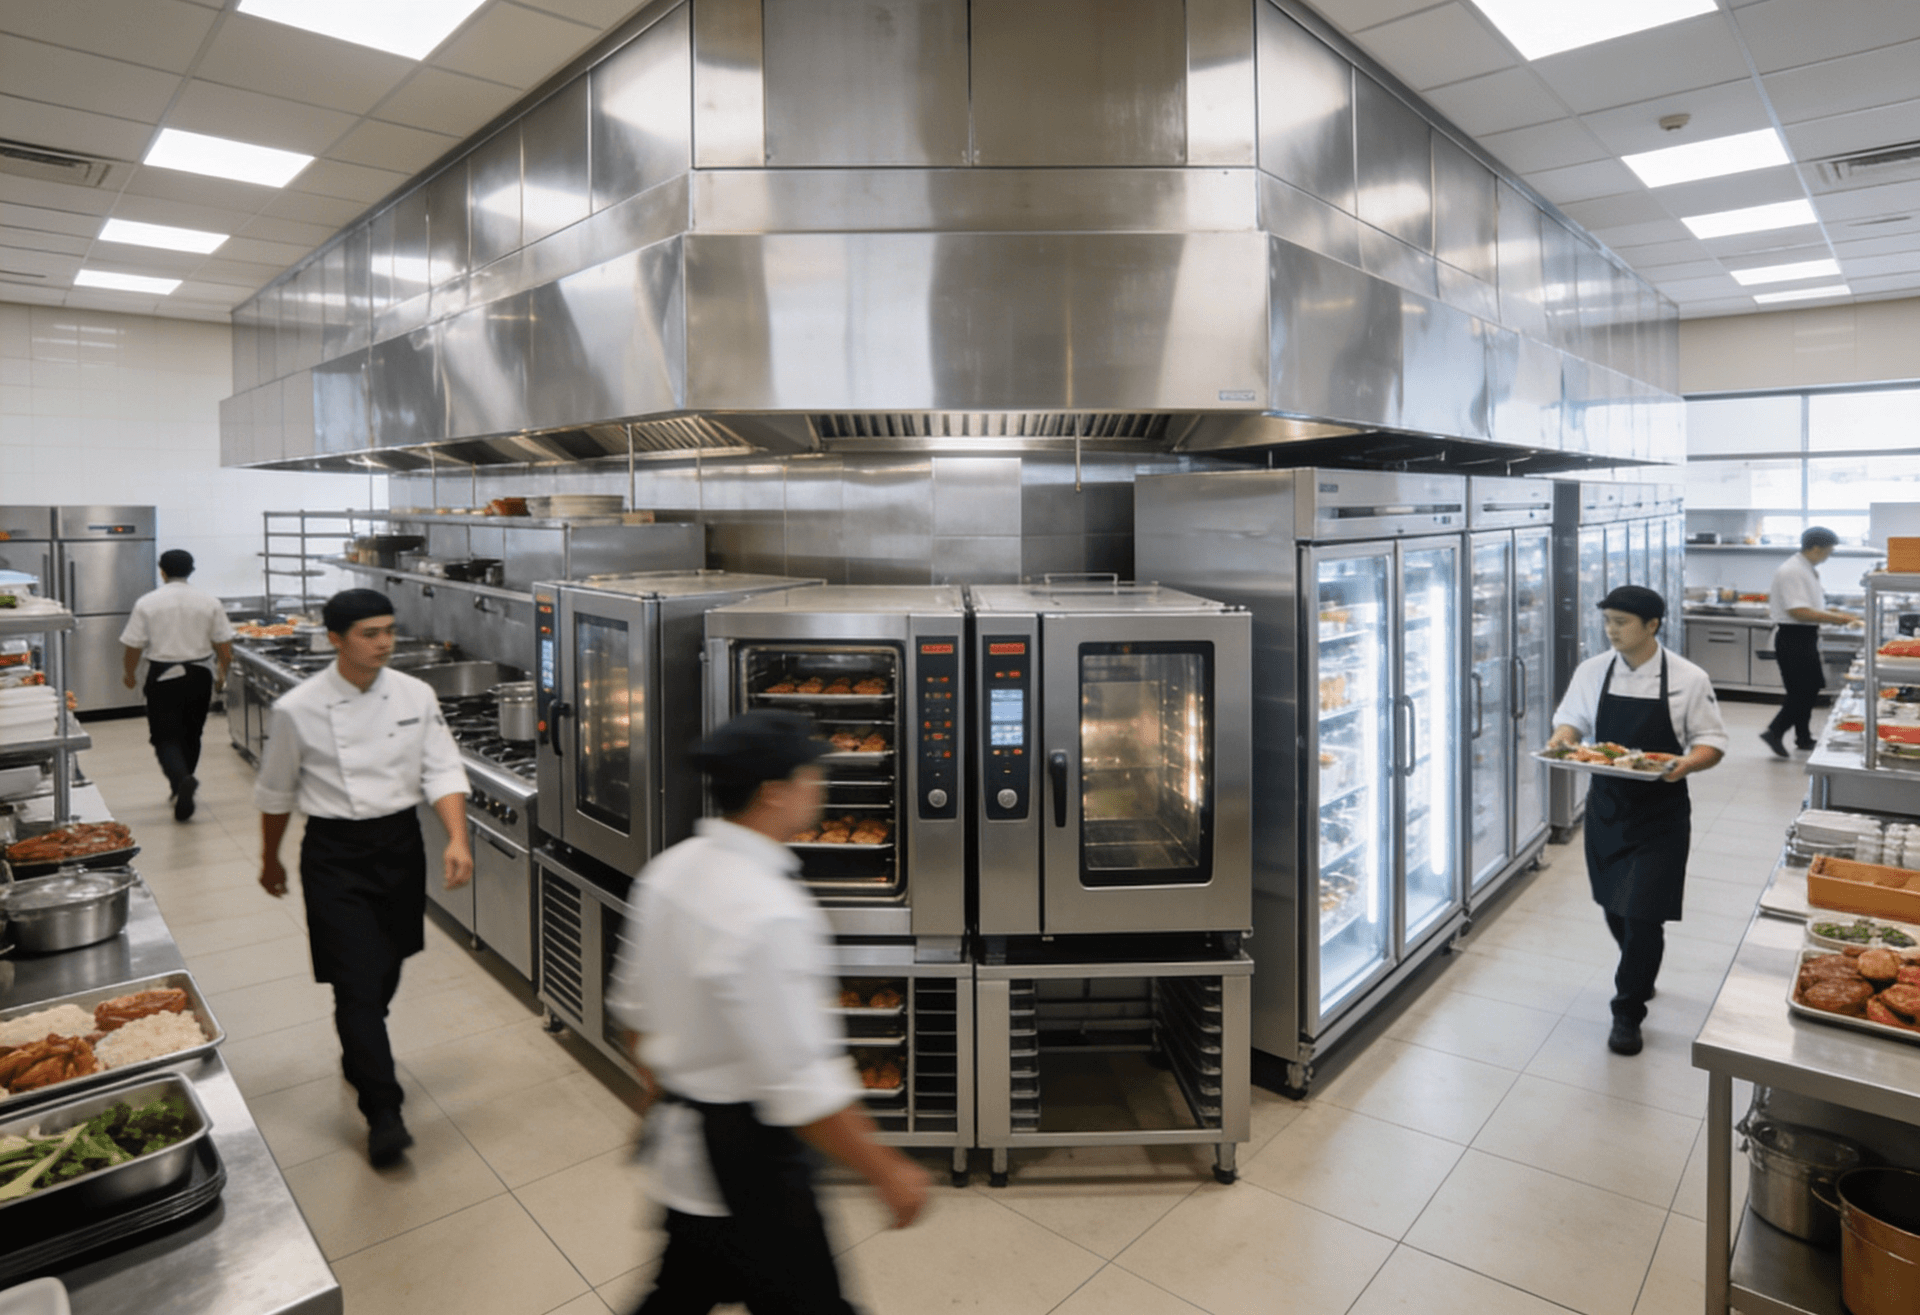
Large kitchens
Analysis per component, day of the week, and season – robust enough to refine meal plans with precision.
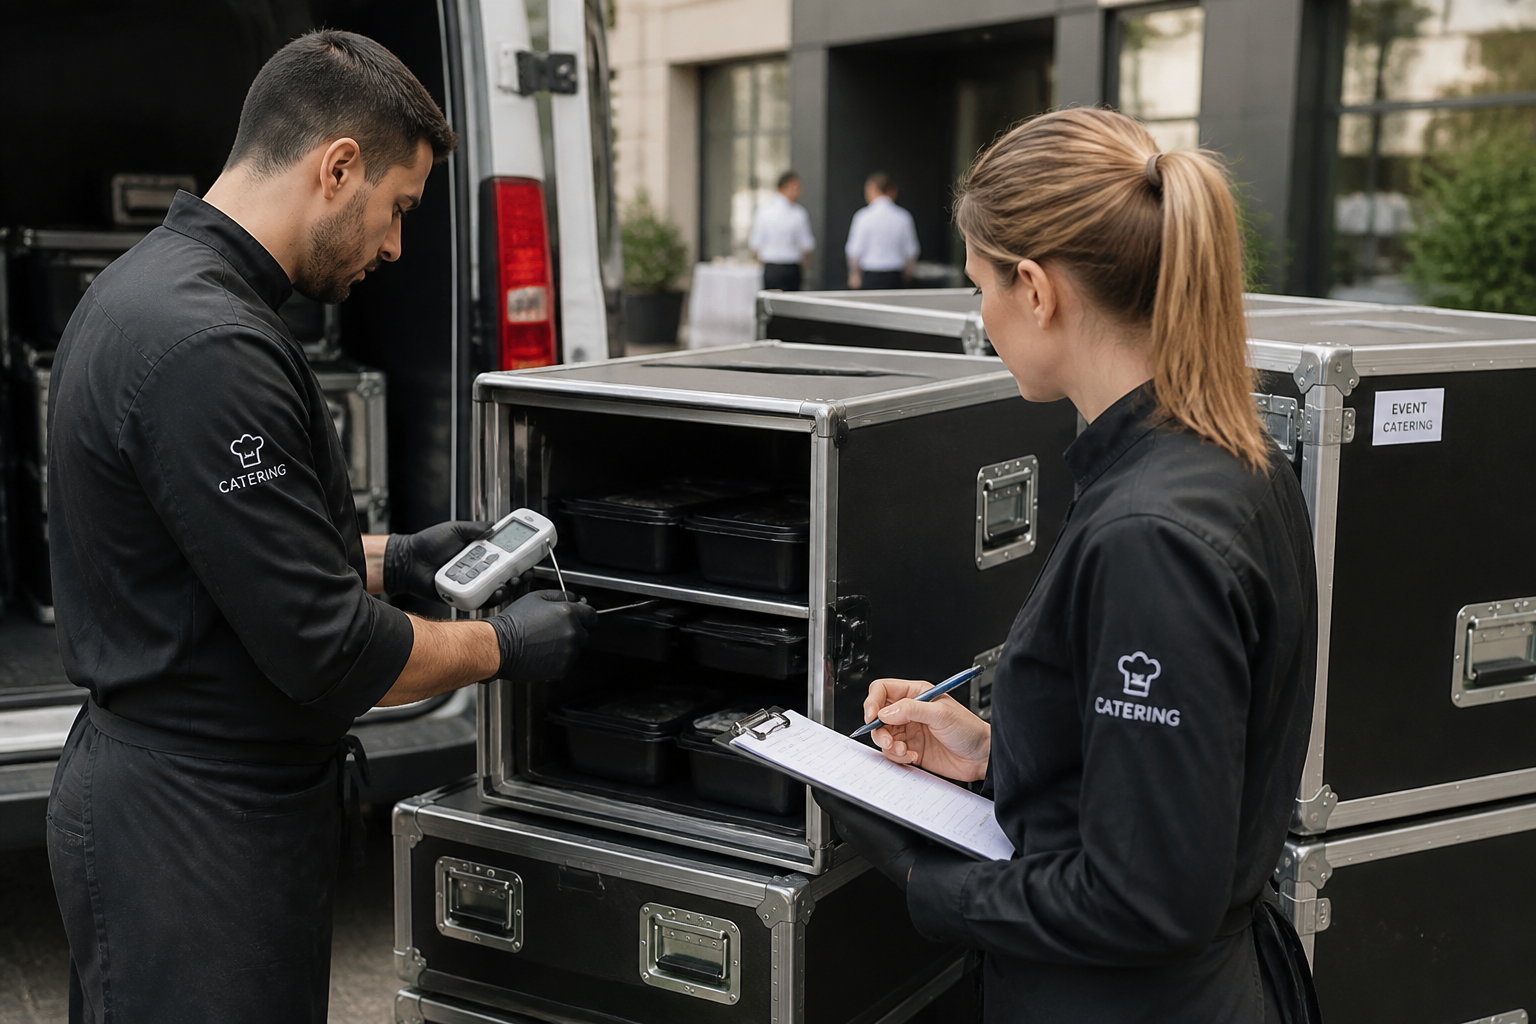
Catering
Track event- and tour-specific waste transparently – your next event benefits from the insights of the last.
Service Partners
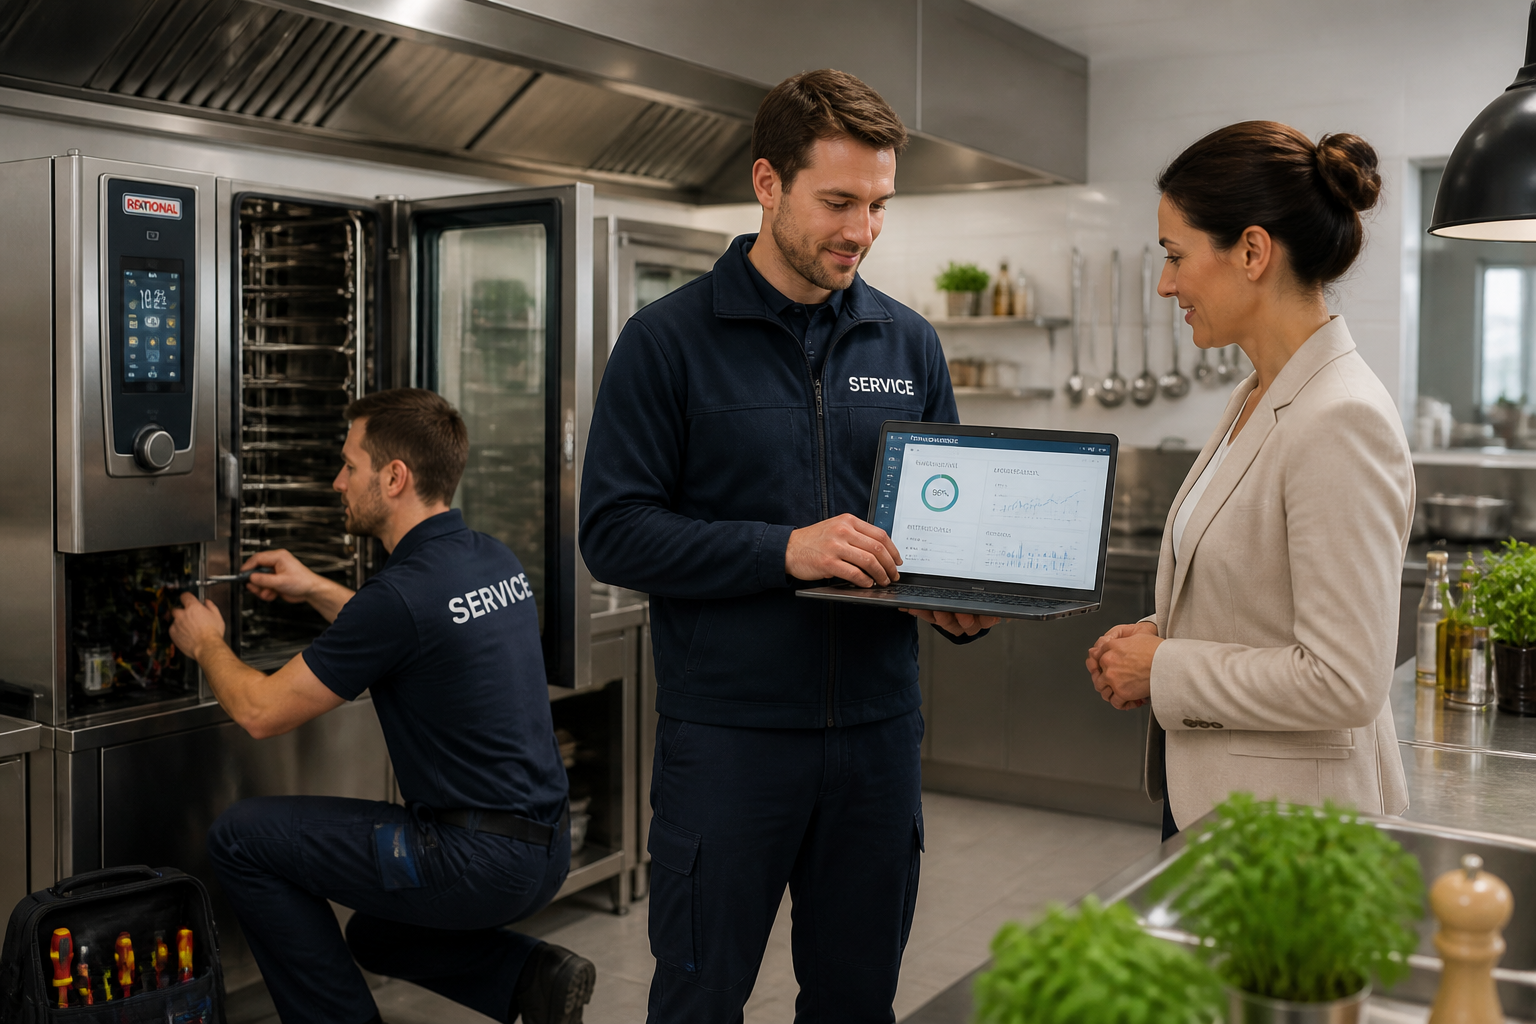
Data-driven consulting: showing where and why waste occurs—not based on gut feeling, but on reports.
FAQ
Frequently Asked Questions About Food Waste and Quantity Planning
What does the Food Waste module in Kibi Scada do?
Kibi Scada records the quantities produced and dispensed per component and menu. The difference gives the remaining quantity—analyzable by day, component, menu, and location. This creates a reliable basis for targeted adjustments to meal plans, order quantities, and portion sizes.
How are components and menus maintained?
Components and pre-configured menus are created in Kibi Scada. For each component, you can define standard portions, allergens, and planned quantities.
How do bulk data get into the system?
Daily production and output quantities are recorded—either manually or via scale integration. In practice, a quick daily routine has proven effective, where the kitchen team notes the quantities during the dishwashing process.
What insights does the dashboard provide?
Waste hotspots per component, day of the week, location, and menu. Trends over weeks and months. Impact of adjustments in before-and-after comparisons. Exports as PDF and CSV for internal reports or sustainability reporting.
How does this fit with MenüMobil and regeneration programs?
When MenuMobil carts are controlled via Kibi Scada, the planned components and quantities per tour are fed into the food waste module. After use, the remaining quantities are recorded—allowing the evaluation to capture tour, location, and component in a single data set.
Can a sustainability report be generated from this?
Yes. Food waste reports can be exported by location and period—showing absolute quantities, reductions compared to previous periods, and benchmarks such as meals produced. Ideal as a data foundation for internal ESG and sustainability reports.
Which KPIs typically improve?
Actual results depend on the starting point. In projects with clear quantity tracking and targeted adjustments, reductions in the double-digit percentage range are realistic. The platform provides the data; the actions emerge from discussions within the kitchen team.
Want to see reduction potential based on real residual quantity data?
We’ll show you live how Kibi Scada turns leftover quantities into reliable decisions for meal planning, production, and sustainability goals.

Persönlicher Ansprechpartner
Christofer Wesseling
Founder & Managing Director · Weslink GmbH
We show Kibi Scada live on your equipment, advise you personally on integration and onboarding, and support the rollout in your operation.
Last updated: