Feature · Dashboard
The central kitchen hub for smooth operations, technology, and quality
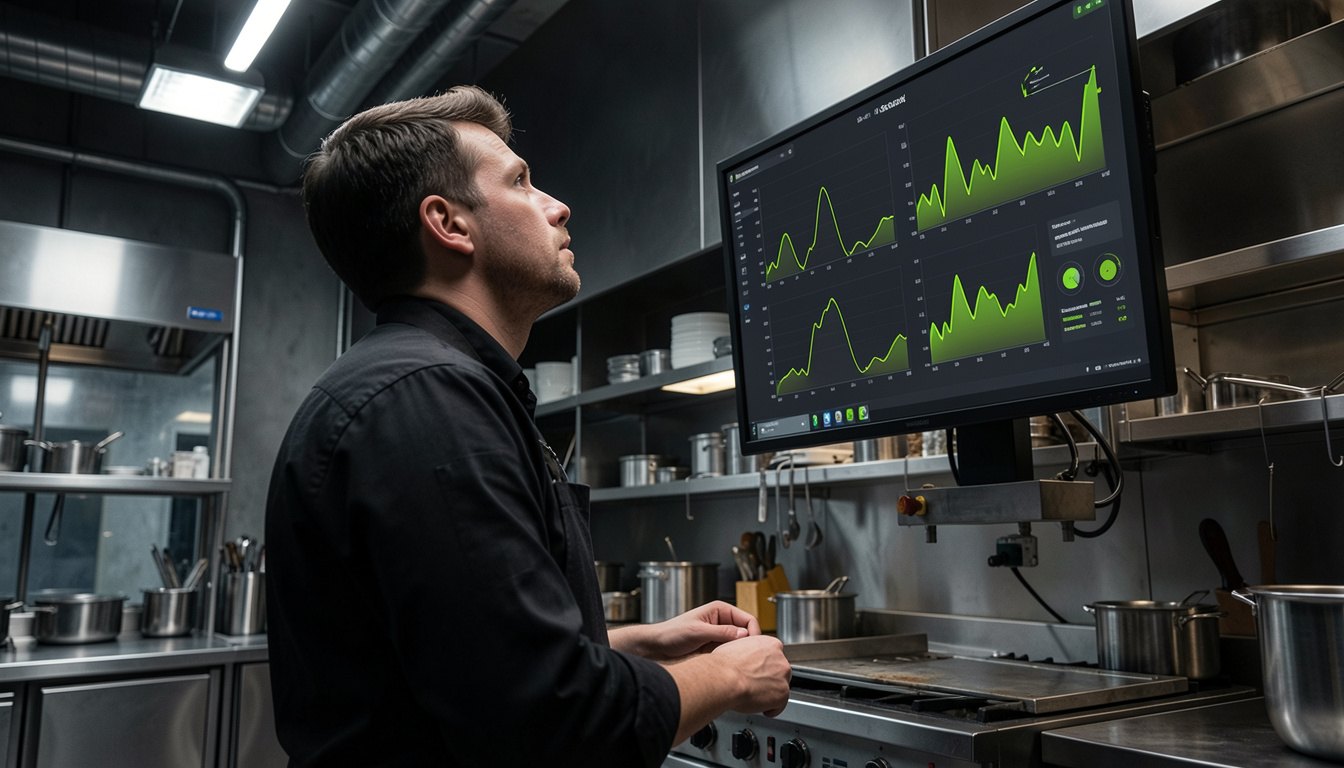
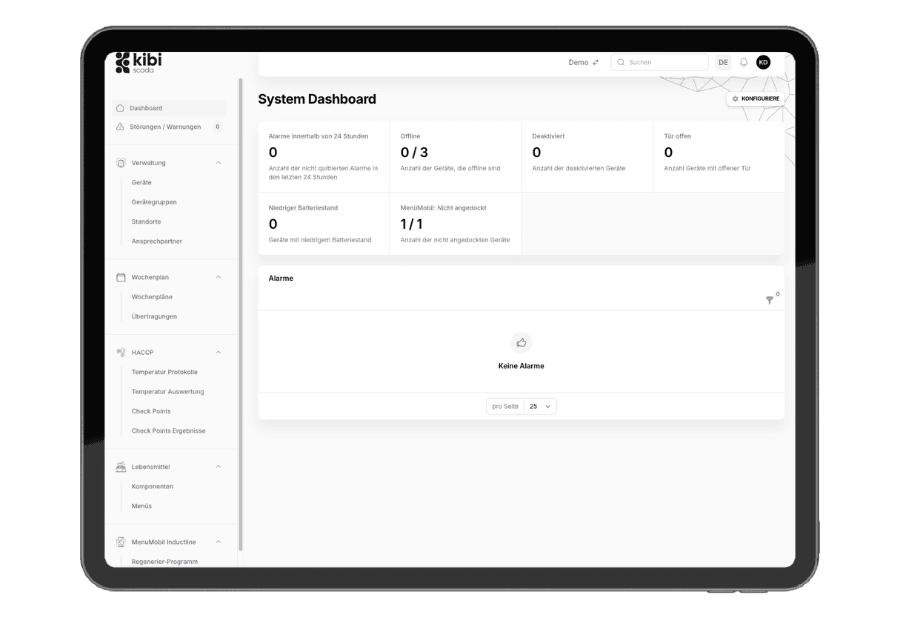
The dashboard shows device status, temperature trends, and active alarms for all locations in one interface—no switching between systems.
- Multi-site status dashboard with drill-down to individual devices
- Device status, trends, and alerts in a live interface
- PWA for desktop, tablet, and smartphone—no app required
Auf einen Blick
A dashboard for visibility, prioritization, and response
See not just values, but assess conditions, evaluate alarms, and drill down directly to the root cause. This is exactly the transition the dashboard as a workspace represents.
Typische Bausteine
Arbeitsweise
From the big picture to the root cause
Three essential actions teams constantly need in daily operations: gaining an overview, diving into details, and correctly assessing deviations based on history and context.
Open overall view
The dashboard consolidates all locations, device groups, and open alerts in a single startup view. Irregularities are immediately visible—no need to click through lists or reports.
Drill down to the device
Teams can jump straight from the site view to the affected device. There, they’ll find current values, historical data, recent alerts, and the operational context—all ready to go.
Evaluate trends and measures
Trends, alarm markers, and benchmark values reveal whether an issue is a one-time deviation or a creeping problem. This turns overview into real control.
Im Detail
What a modern monitoring dashboard needs to deliver in a kitchen environment
Large operational areas, numerous devices, and tight response windows require a platform that prioritizes instantly, remains sufficiently in-depth, and works just as smoothly on mobile as it does at headquarters.
Multi-Site
All locations in one reliable, comprehensive view
The dashboard scales from a single kitchen to distributed branch networks. Not every detail needs to be visible at all times—but every critical deviation must stand out immediately.
- Site status with traffic light logic and prioritization
- Filter by region, tenant, device group, or responsibility
- Drill down from the map to individual sensors
- Multi-tenancy for operators and service partners
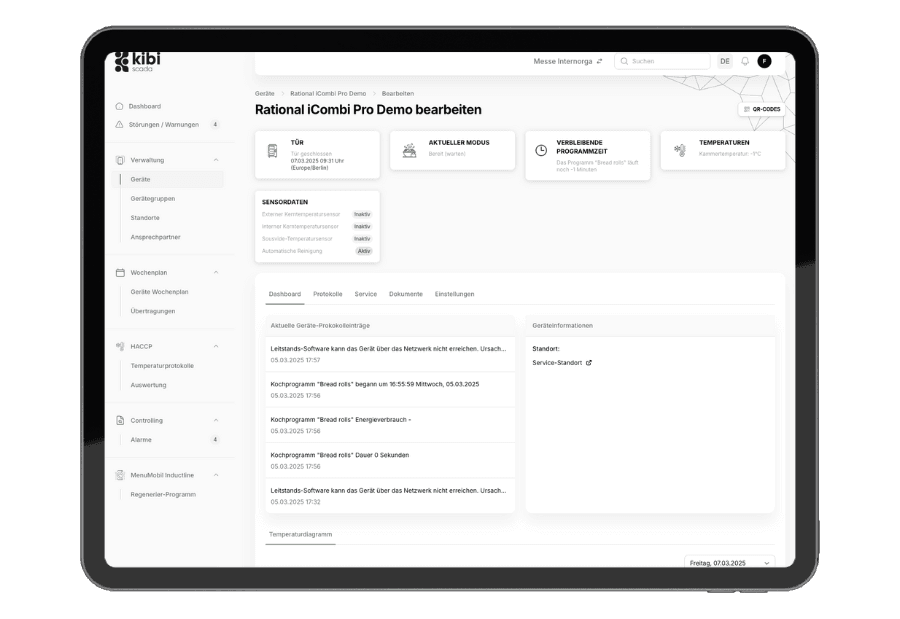
Device Status
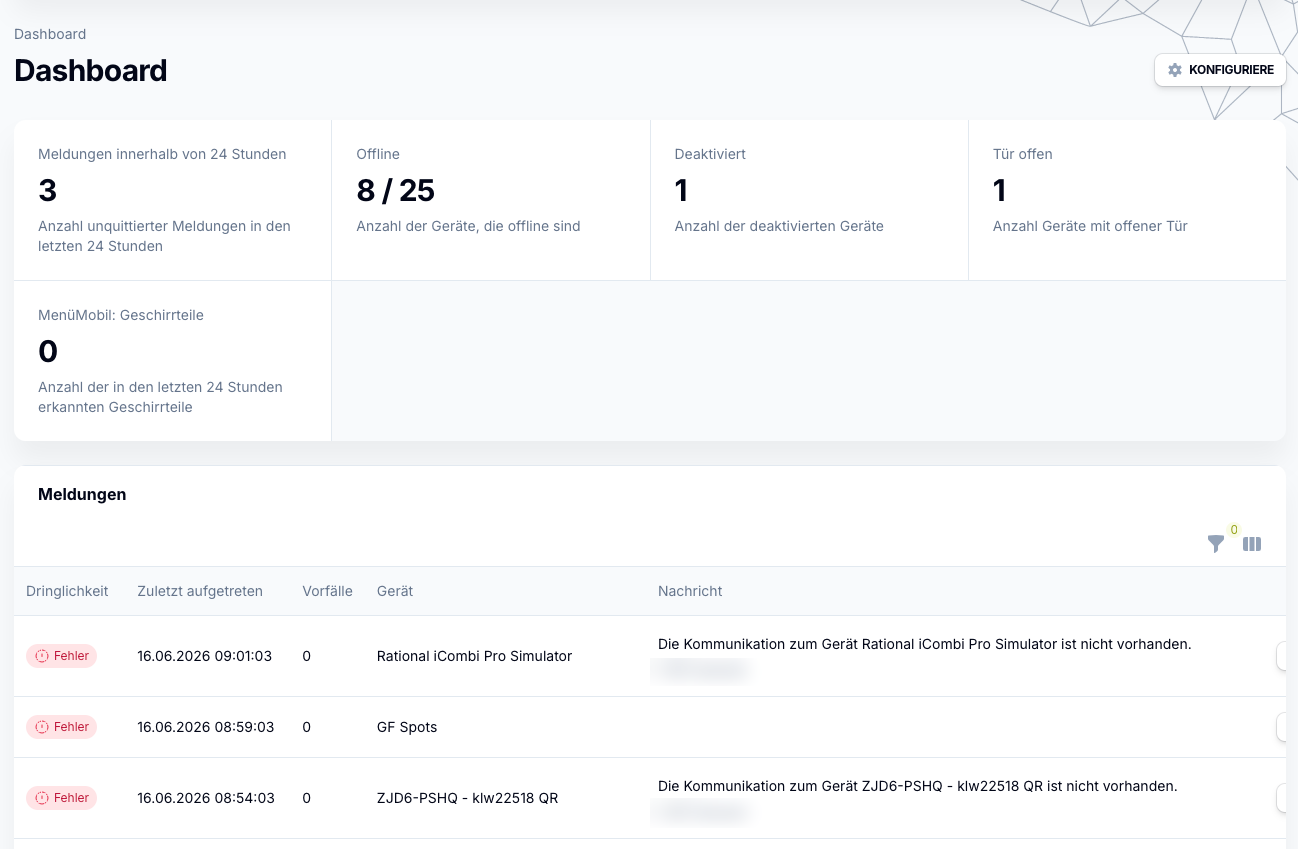
Every device can be read as an operational status
Not just temperature readings matter—connection status, last transmission, and open actions are just as important. The dashboard displays devices as operational units, not just data points.
- Keep an eye on current values with target ranges and thresholds
- Connection status and sensor condition on the same map
- Direct access to history, alerts, and service context
- Quickly prioritize critical devices by condition
Trends & Mobility
Overview and analysis remain easy to handle on the go
The dashboard isn’t just a wallboard for headquarters. Kitchen management, technical teams, and on-call staff all access the same interface—complete with history, filters, and exports.
- Compare time trends over hours, days, or months
- Threshold lines and alerts visible directly in charts
- PWA for home screen use and mobile responsiveness
- PDF and CSV exports from operational views
Einsatzfelder
Where a powerful control center delivers immediate operational impact
When multiple locations, responsibilities, or critical equipment groups come together, the quality of the dashboard determines response speed and controllability.
Hospitals
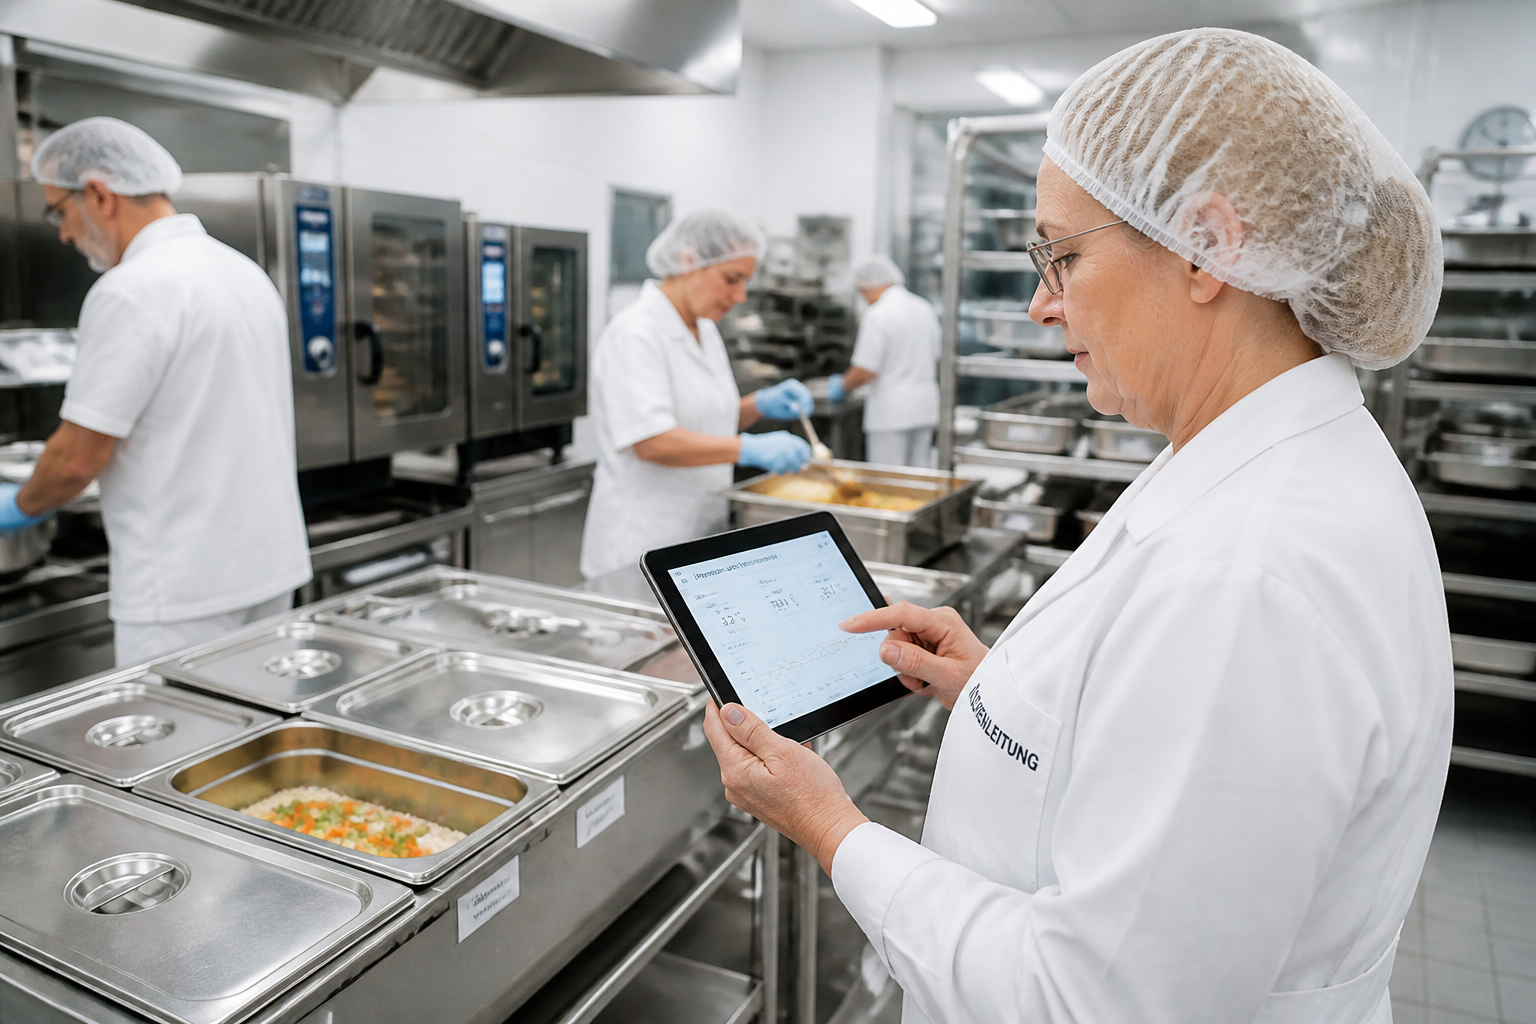
Distributed kitchen, technical, and hygiene teams need a platform that neatly consolidates alert pathways, documentation, and location data.
Large-scale kitchens
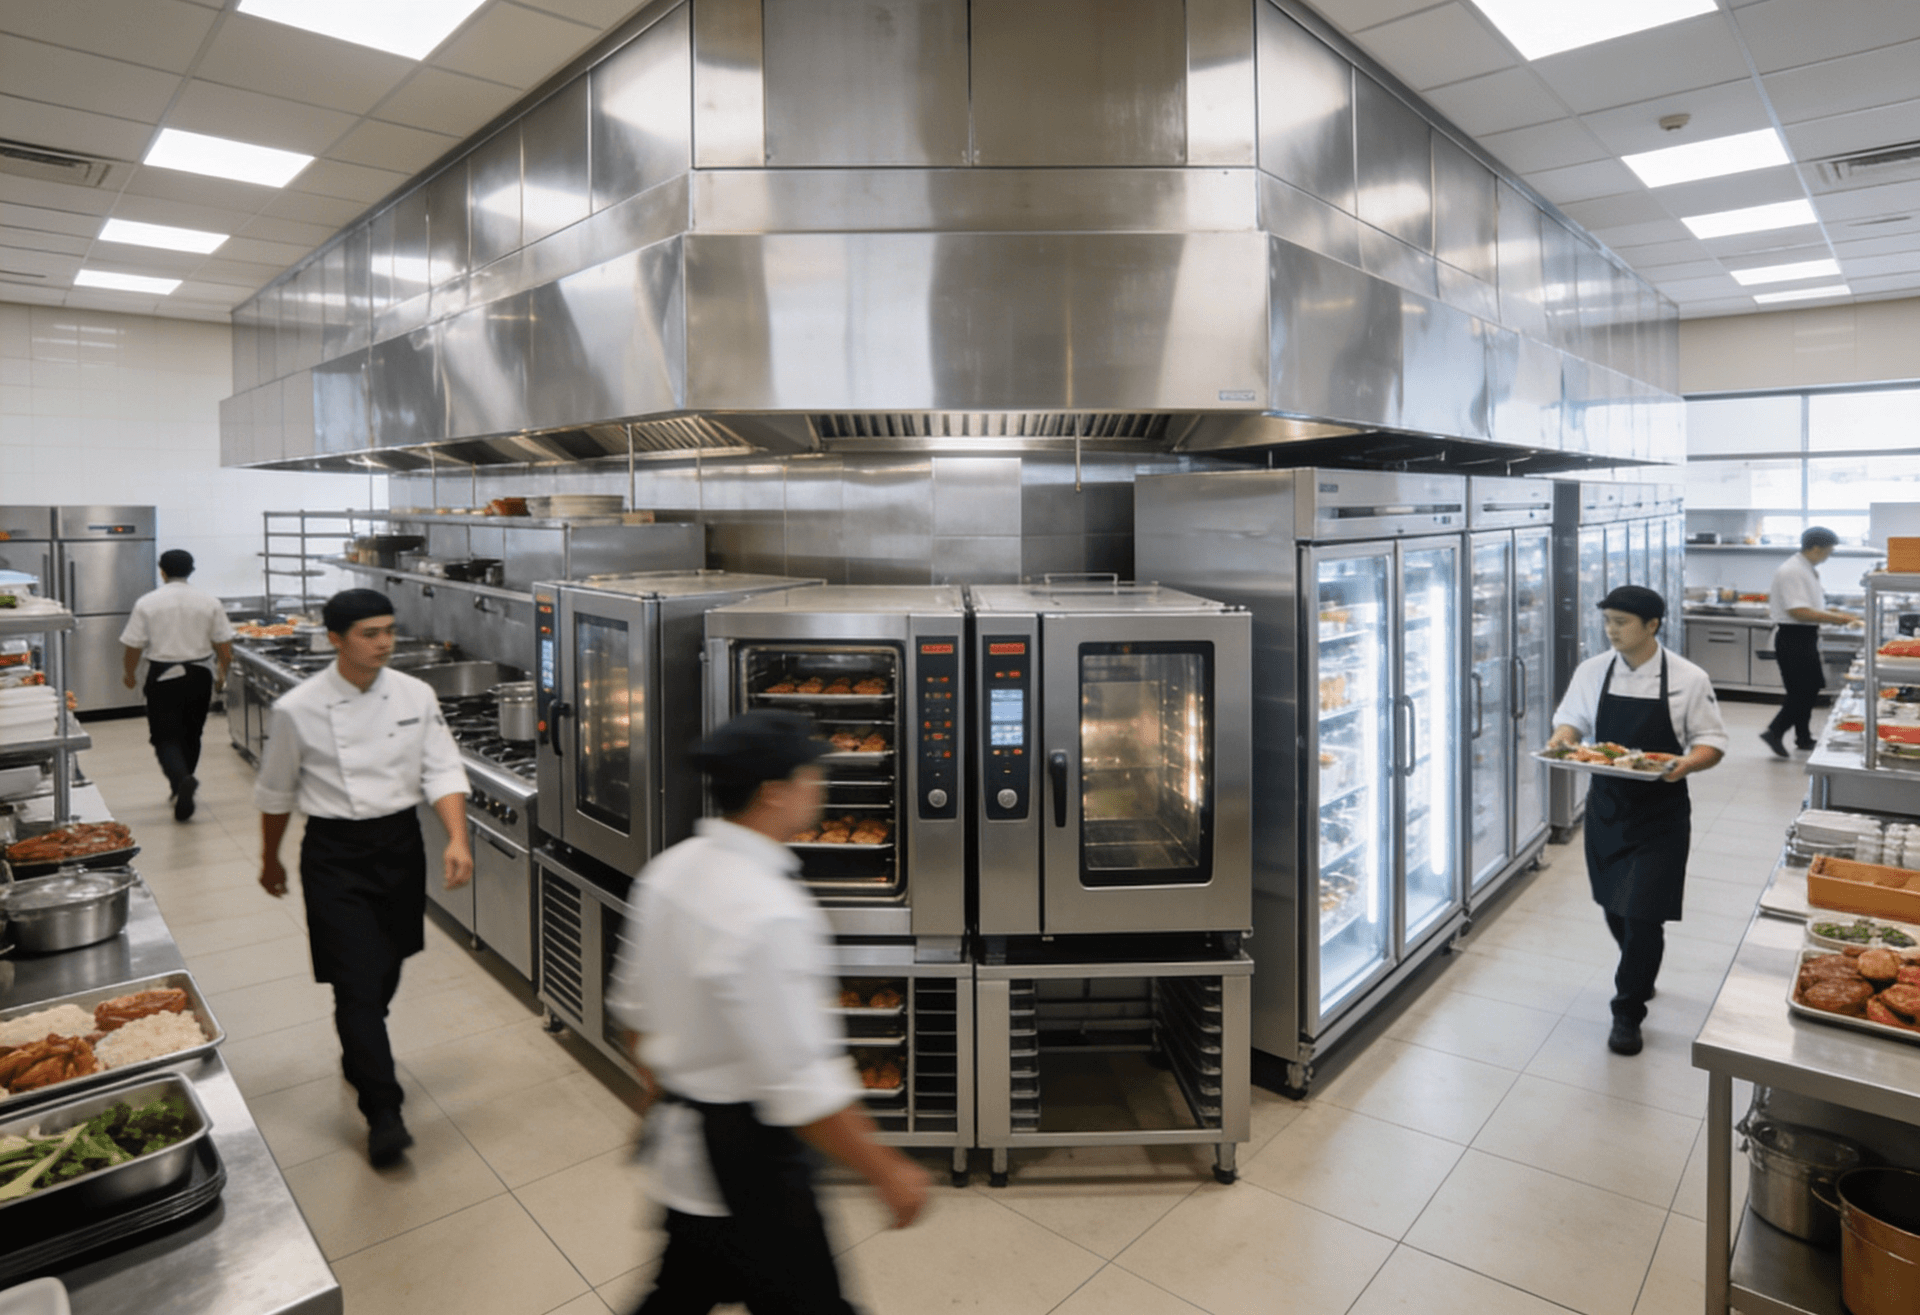
High documentation requirements, numerous devices, and tight operational windows make seamless transparency on the platform especially valuable.
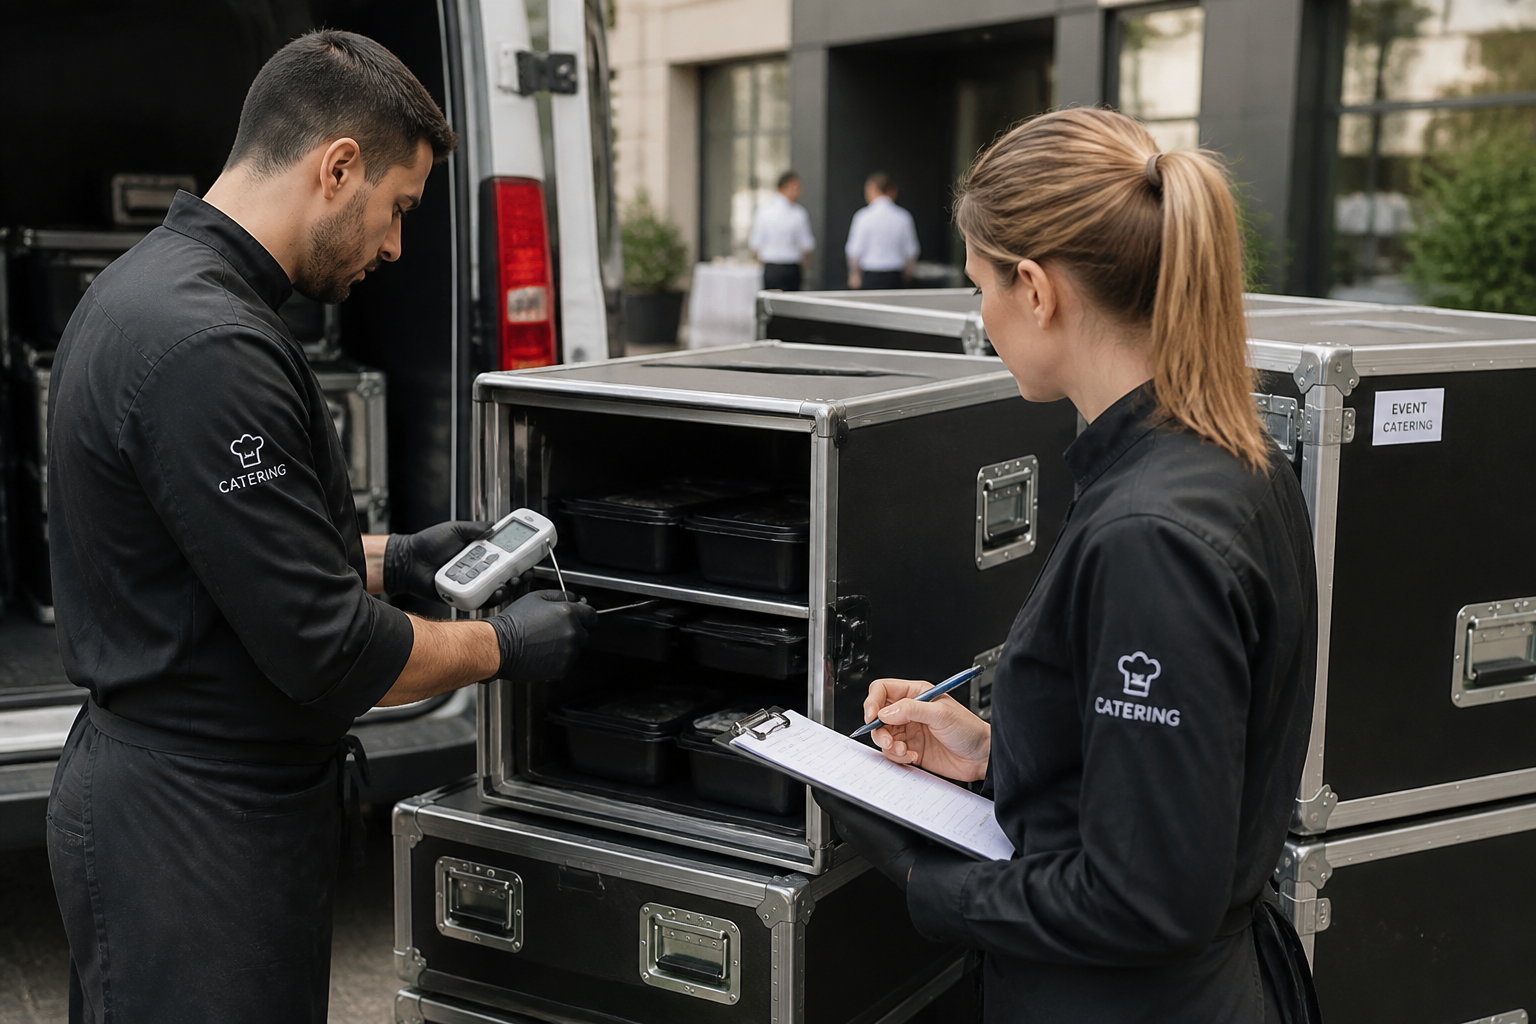
Catering
Mobile processes, multiple output points, and shifting teams benefit from a central system for monitoring, alerts, and reporting.
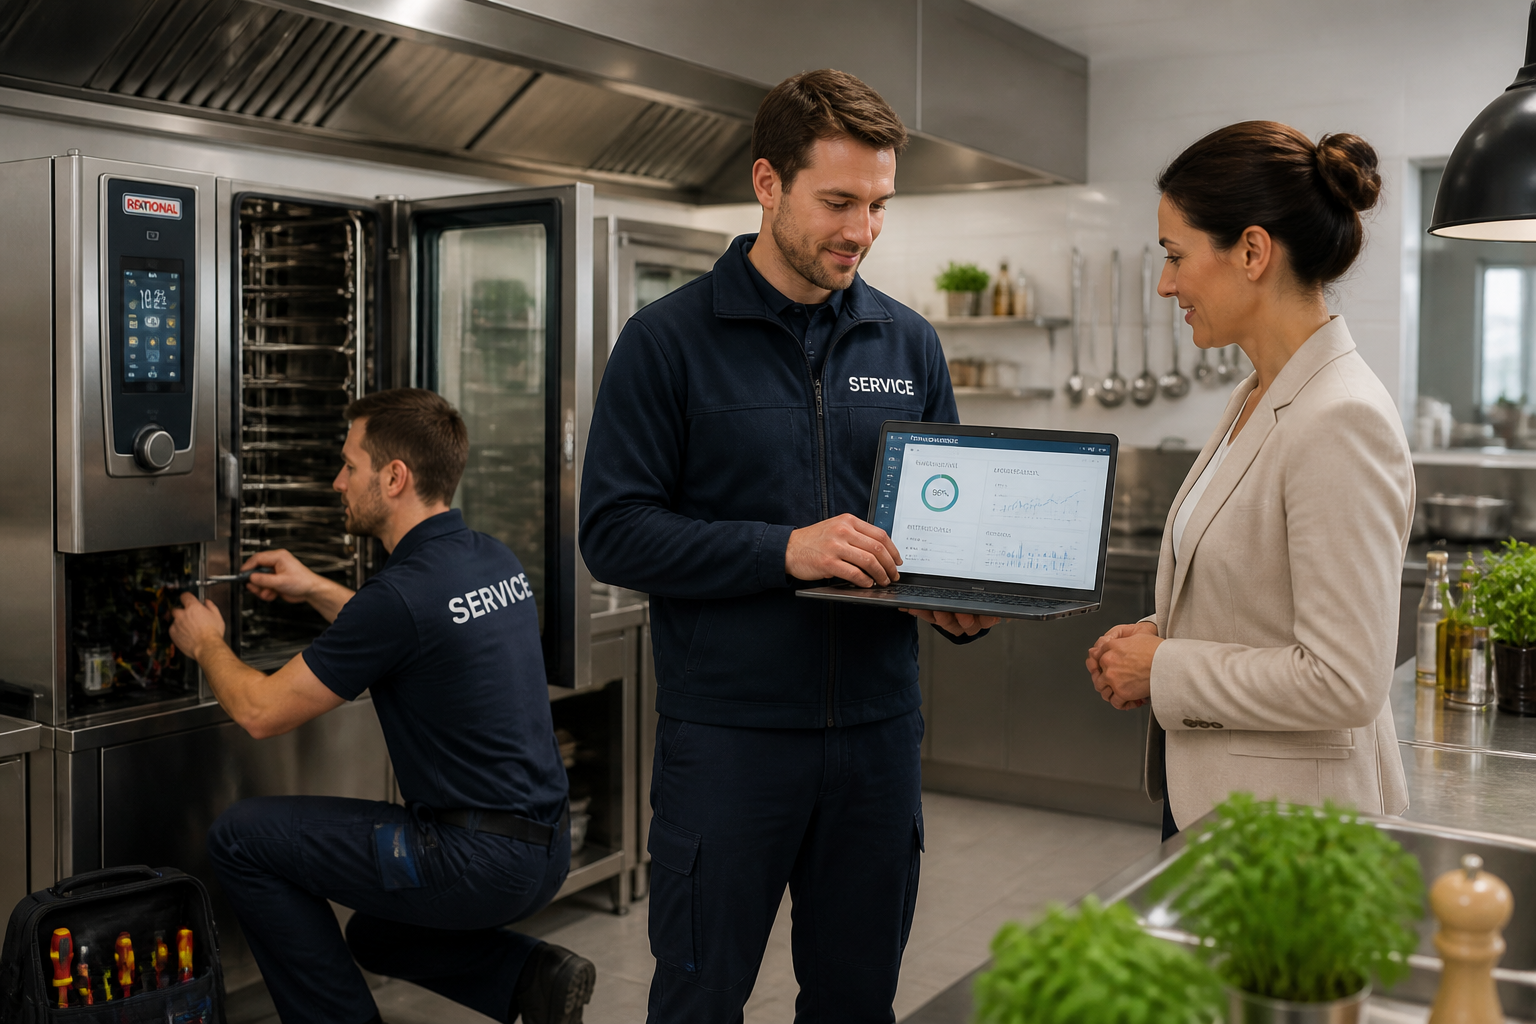
Service Partners
Tenants, technical responsibilities, and documented measures can be consistently managed on a single platform.
FAQ
Frequently Asked Questions About the Dashboard
Can I use the dashboard on multiple devices at the same time?
Yes, the Kibi Scada dashboard is a web-based application and can be opened on any number of devices simultaneously—on the desktop monitor in the head office, on the tablet in the kitchen, or on the smartphone while on the go. The view is fully responsive and automatically adapts to the screen size.
How up-to-date is the data in the dashboard?
Data is continuously updated. As soon as a sensor transmits a new measurement, it appears in the dashboard shortly after. The update rate depends on the configured measurement interval of the sensors—by default every 10 to 15 minutes, or even every minute if required.
Can I create custom widgets and views?
Yes, the dashboard is flexibly configurable. You can create custom views, arrange and filter widgets—for example, to display only the refrigeration units at a specific location. Each user can save their personal dashboard view.
How many locations can you keep an eye on at the same time?
There is no technical limit to the number of locations. Whether you manage a single large kitchen or hundreds of sites across a restaurant chain—your dashboard scales with you. The multi-location view gives you a quick overview of all sites and their status.
Can I export reports directly from the dashboard?
Yes, you can export reports directly from any dashboard view as a PDF or Excel file. You can also set up automatic report subscriptions to receive regular summaries by email—daily, weekly, or monthly.
Is there a mobile app for the dashboard?
The dashboard is designed as a Progressive Web App (PWA) and works like a native app on any smartphone browser. You can install it on your home screen and receive push notifications for alarms. No separate app installation from the app store is required.
What roles and permissions are available in the dashboard?
Kibi Scada offers a role-based permission system. Administrators can create users and assign roles—from read-only access for kitchen staff to full access for kitchen management. Each role defines which locations, devices, and functions are visible.
Can I analyze historical data in the dashboard?
Yes, the dashboard offers comprehensive analytics features. You can visualize temperature trends over any period, identify patterns, and compare readings from different sensors. All historical data is stored for at least three years and is available at any time.
See the dashboard, drill-down, and mobile use live?
We show how Kibi Scada prioritizes locations, prepares device details, and presents trends so that technical teams and operations can assess the situation in the same way.

Persönlicher Ansprechpartner
Christofer Wesseling
Founder & Managing Director · Weslink GmbH
We show Kibi Scada live on your equipment, advise you personally on integration and onboarding, and support the rollout in your operation.
Last updated: