
Solution · Costs & Sustainability
Understand energy costs and reduce them effectively
Kibi Scada makes energy consumption visible per device and site and relates it to operational metrics such as meals served or seats.
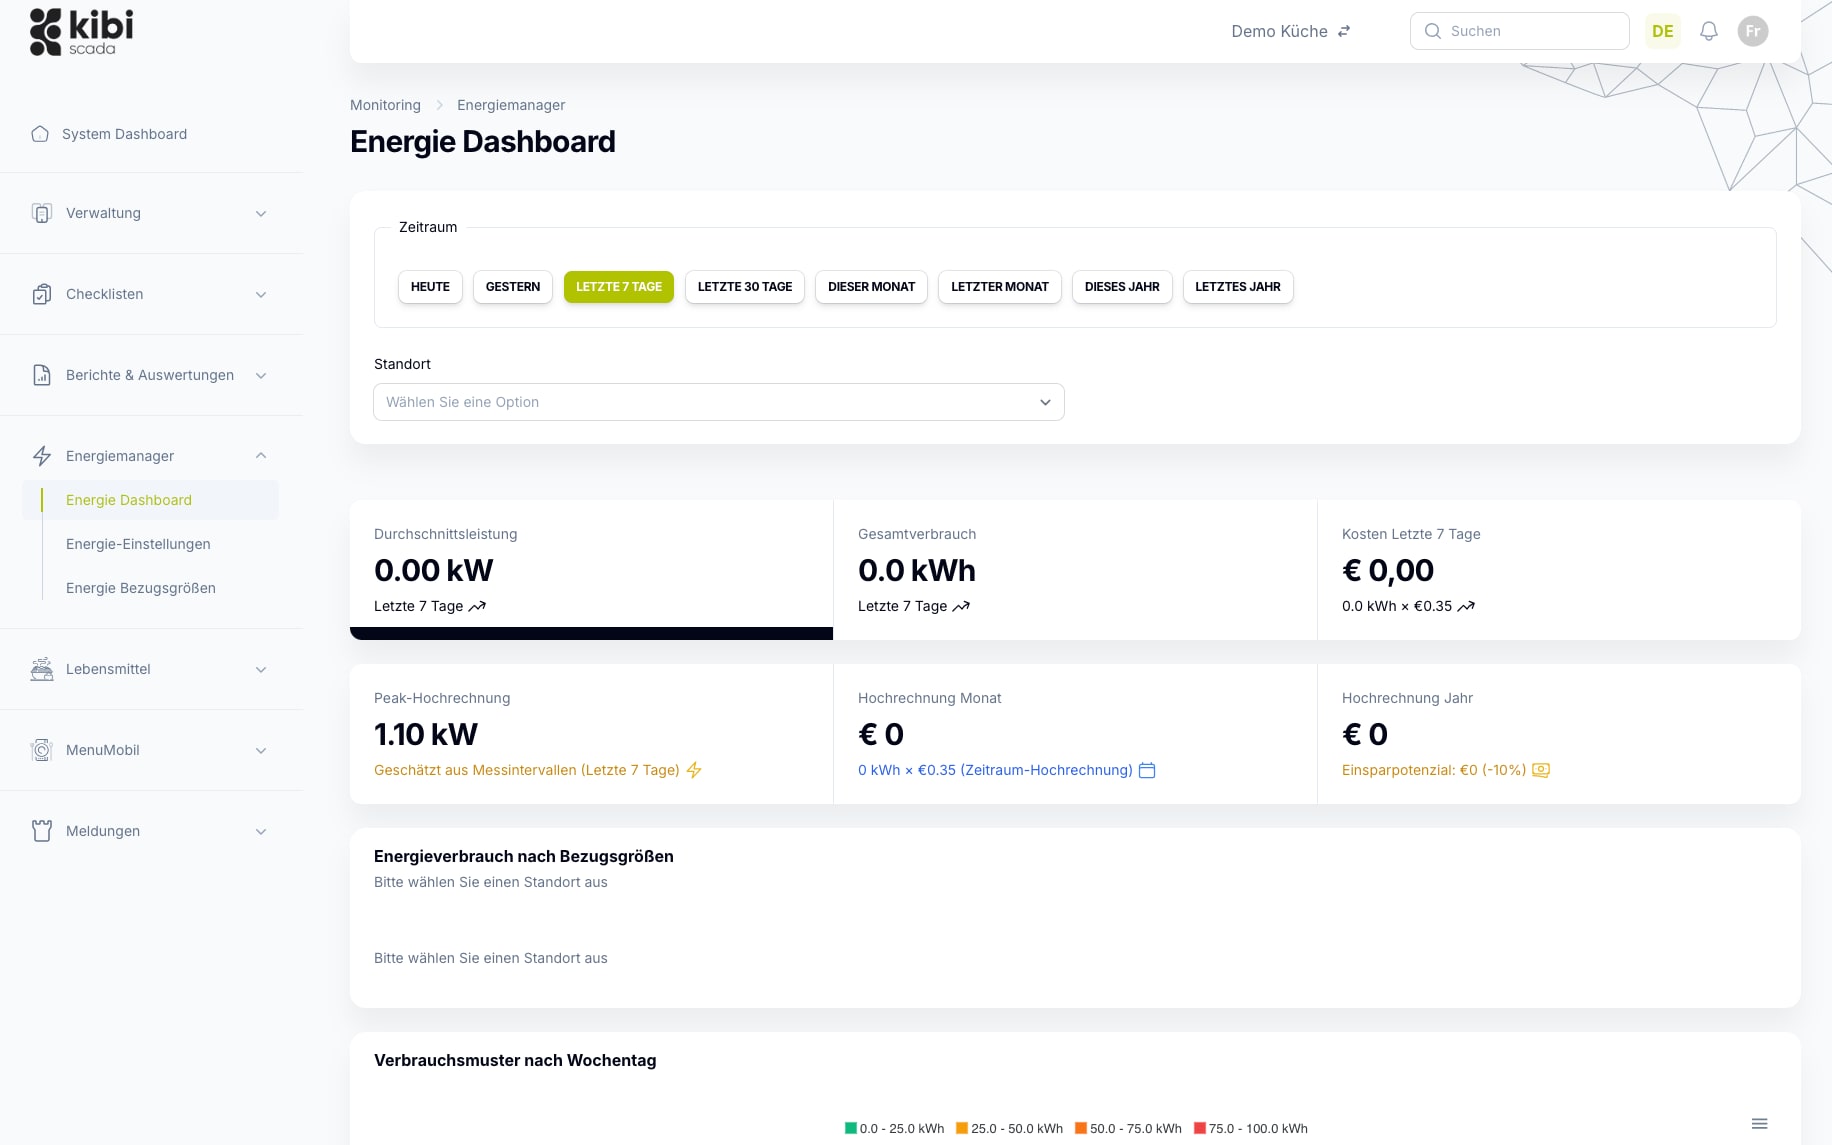
Live energy consumption per device, device group, and location
Reference values such as meals or seating capacity make consumption comparable
Reports for ESG reporting, audits, and operational management
Ausgangslage
Why energy management in commercial kitchens is often hard to control
Many organizations already track consumption data, but lack a reliable basis for decision-making. The real challenge is rarely the measurement itself—it’s the missing ability to contextualize, compare, and leverage the data.
Usage is visible, but not comparable
A meter reading or a monthly bill won’t tell you whether a site is operating efficiently. Without benchmarks, energy remains costly and analytics blunt.
Peak loads are only noticed when they start costing money.
When consumption data is only reviewed retrospectively, peaks, misconfigurations, or inefficient equipment can hardly be addressed operationally.
Sustainability and cost reports create additional effort
ESG, CSRD, or internal energy reports are often compiled manually. This ties up resources and creates little trust in the data foundation.
Lösung durch Kibi Scada
How energy data becomes a real foundation for control
Kibi Scada connects consumption, reference values, and reporting in a way that allows operational teams and management to work with the same data.
Usage is placed in its operational context.
Meals, seating, or operating hours make locations and equipment realistically comparable. This turns energy from an abstract concept into something you can control.
Deviations become visible early as patterns
Peak loads, atypical time windows, and inefficient devices are detected while there’s still room to act. Decisions are made based on data, not assumptions.
Reporting obligations arise from the same data foundation.
Operational view, management reporting, and sustainability proof come together seamlessly. This eliminates the gap between day-to-day operations and reporting.
Ablauf im Betrieb
How the solution is used in day-to-day operations
From data collection to classification and reporting, energy monitoring follows a seamless workflow. This turns data gathering into a usable management process.
Phase 01
01Connect consumption data
Track energy consumption per device via existing interfaces or Shelly/Dragino measurement modules.
Phase 02
02Maintain reference values
Per location, reference values such as meals produced, seats available, or operating hours are recorded – the foundation for meaningful KPIs.
Phase 03
03Analyze consumption
Energy dashboard, comparisons between locations or devices, reports as a data basis for ESG and sustainability reports – on a daily, weekly, or annual basis.
Passende Bausteine
Which Kibi Scada modules make this solution possible?
Energy monitoring is built from multiple product components. It’s their interplay that makes comparisons, anomaly detection, and reporting reliable in everyday use.
Dashboard
Consumption, comparisons, and peaks are analyzable in a live interface.
Funktion ansehenReporting
PDF, CSV, and management reports are generated from the same energy data foundation.
Funktion ansehenIntegrations
Seamlessly integrate sensor data, submetering, and device data on a single platform.
Funktion ansehenTypische Einsatzbilder
Where energy monitoring delivers results fast
Whether in hospital kitchens, large-scale catering, catering services, or service partnerships: what matters is a perspective that makes consumption clear in the operational context.
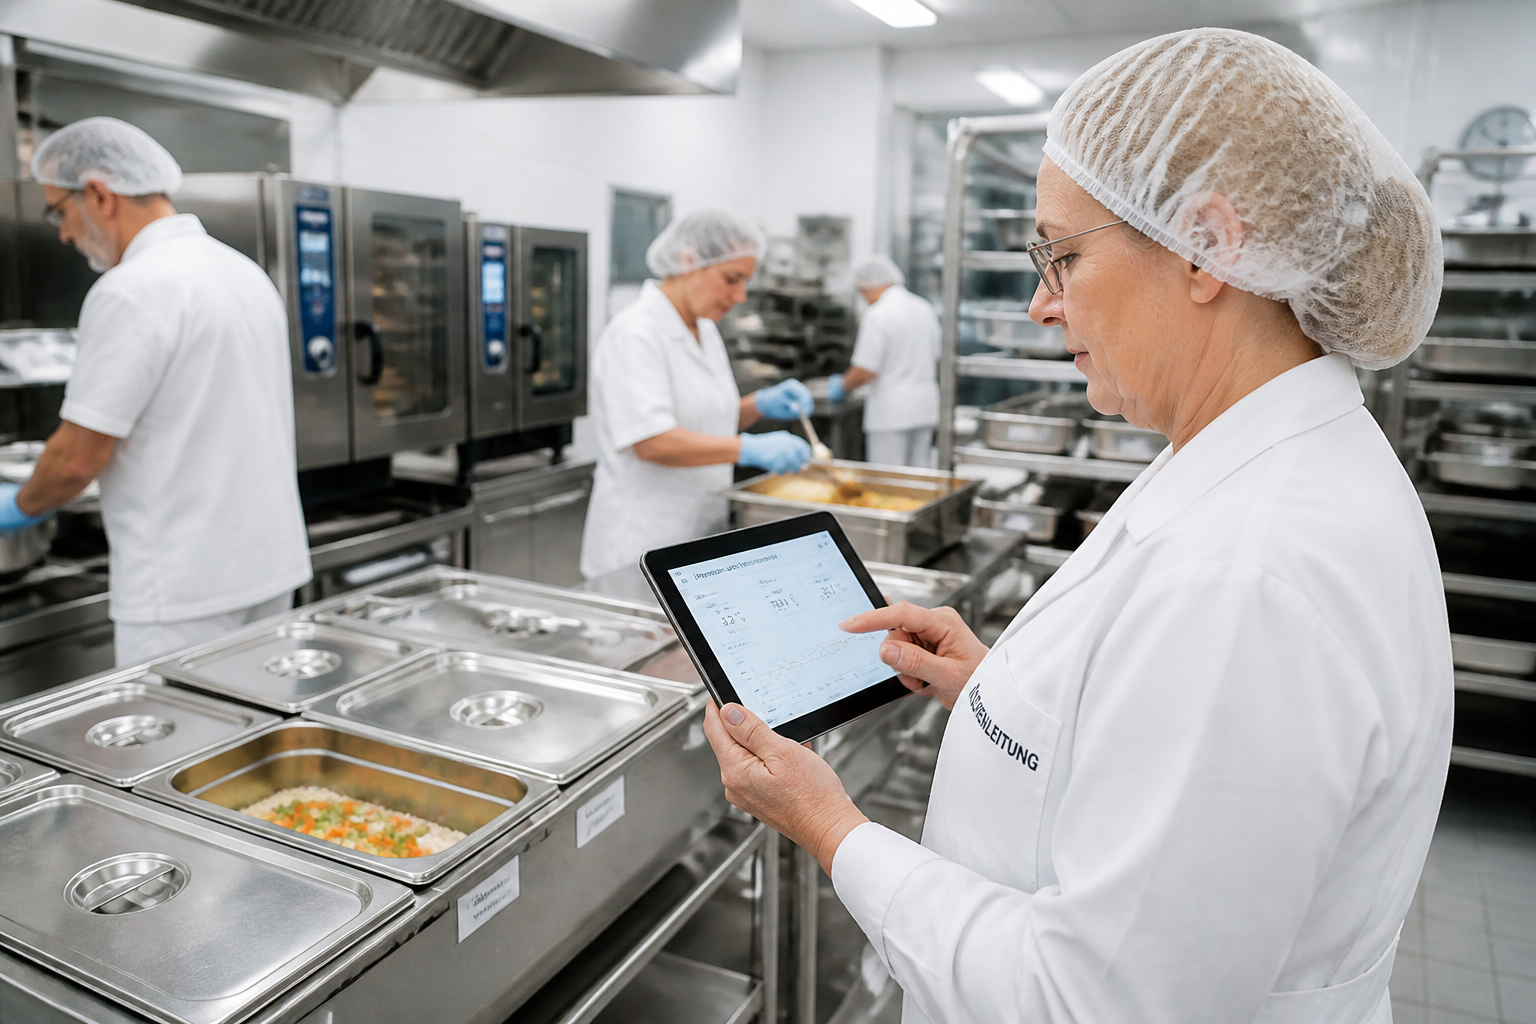
Hospitals
Energy consumption per hospital kitchen as a basis for internal load distribution and sustainability reporting.
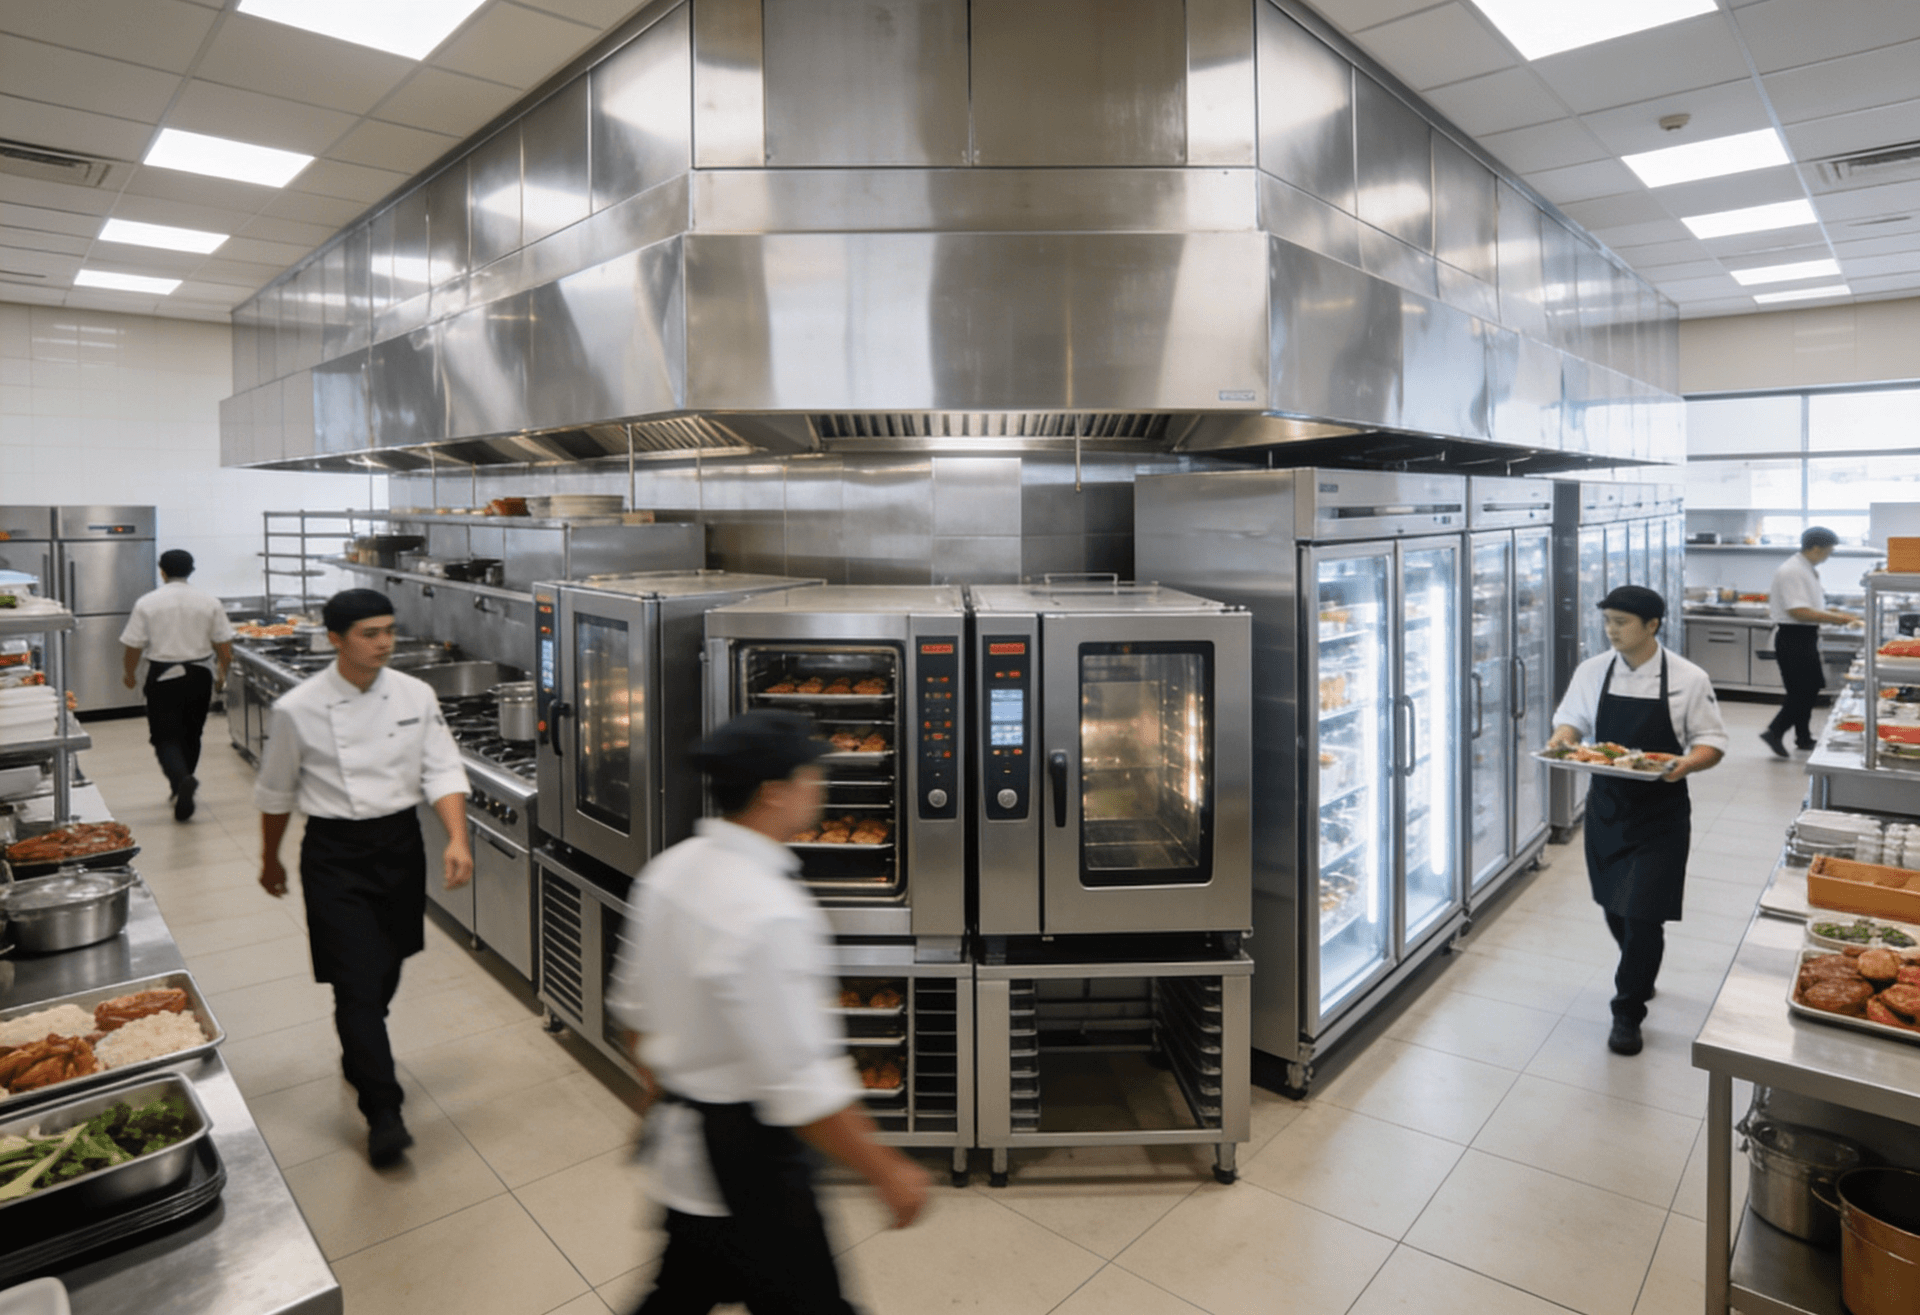
Large-scale kitchens
Monitoring hot-holding units, dishwashers, and combi steamers for consumption – identify and smooth out peak loads.
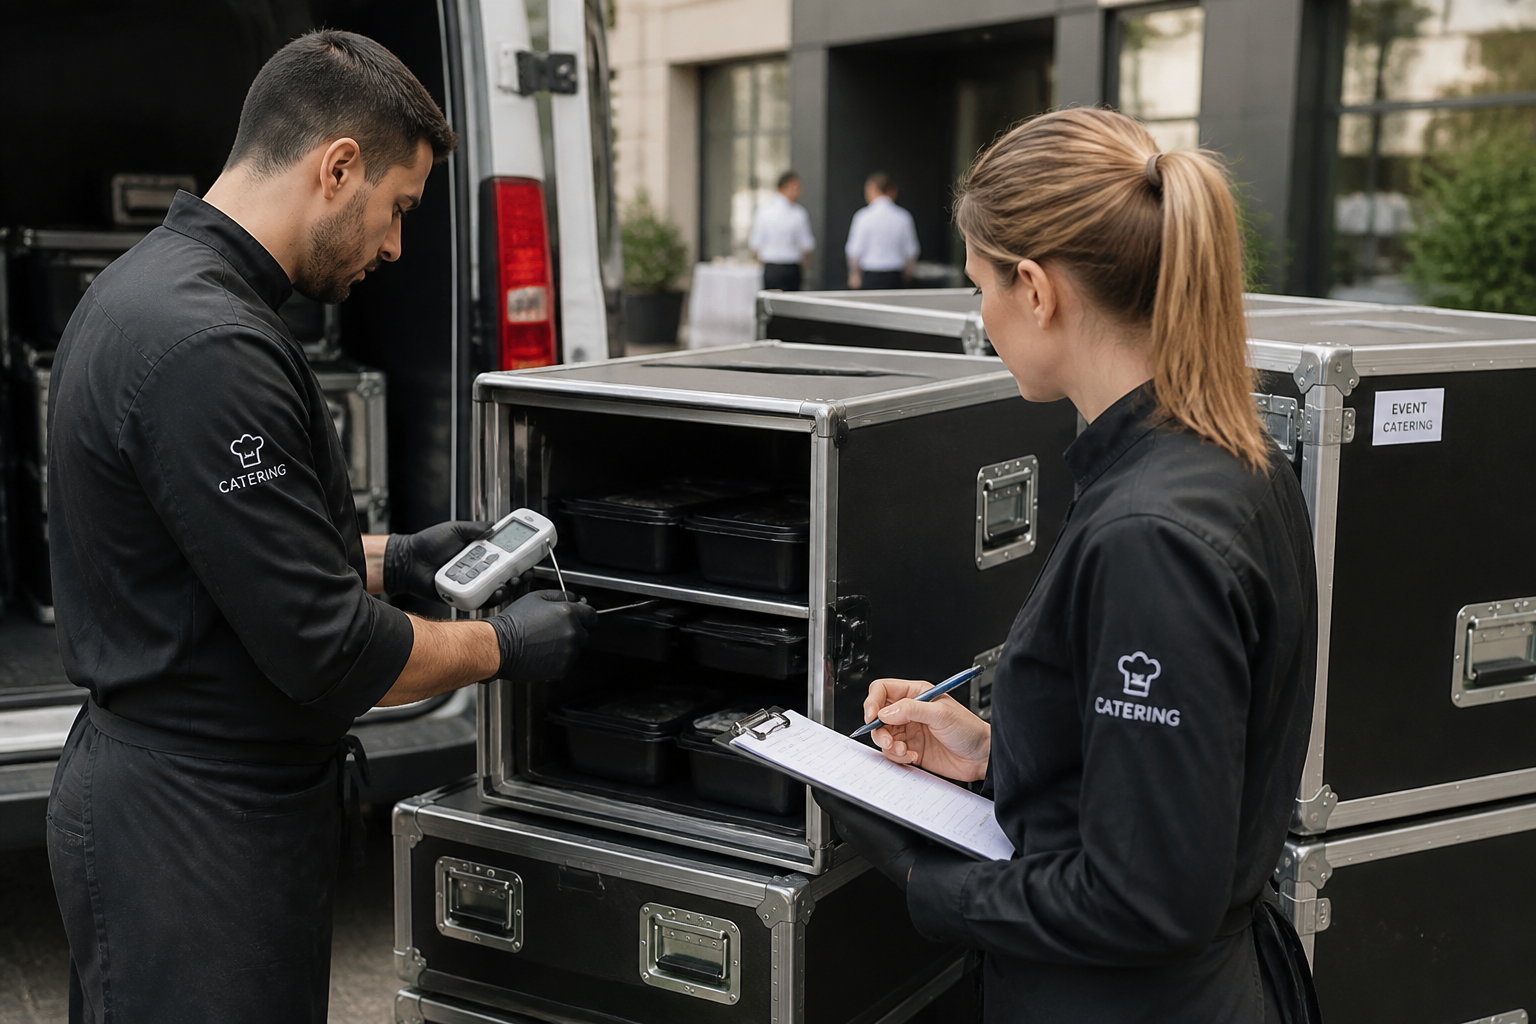
Catering
Track consumption at depots and events separately – pricing based on reliable data.

Service Partners
Prove efficiency gains after maintenance or upgrades – as measurable results, not just promises.
FAQ
Frequently Asked Questions About Energy Costs and Consumption Control
What consumption data does Kibi Scada capture?
With the Energy Modules, you can track power consumption per device, device group, and location. Data is sourced either directly from manufacturer devices with energy interfaces or via sensors such as Shelly power measurement modules or Dragino LoRaWAN meters.
What are energy reference values used for?
Energy consumption in kilowatt-hours alone tells you little. Reference values like meals produced, seats, operating hours, or square meters make locations and time periods comparable—such as consumption per meal or per occupancy day.
What reports does the Energy Module provide?
Energy reports for daily, weekly, monthly, and annual comparisons, site comparisons, peak load analyses, and exports as a data basis for ESG and sustainability reports. All reports are available as PDF and CSV.
How does it help reduce costs?
By making energy consumption visible per device and time window, costly peak loads, inefficiently running equipment, and incorrect programs can be identified. Concrete data enables targeted actions instead of generic calls to save.
Does the energy module work without energy tariffs from manufacturers?
Yes. You can set an electricity price per location, regardless of whether the device itself has an energy interface. The consumption data comes from sensors or submeter measurements.
Can the consumption data be exported for ESG and sustainability reports?
Yes. Energy reports are structured so they can be directly integrated into sustainability reports. Locations, time periods, and reference values can be freely selected; exports are available as PDF for internal documentation and CSV for further processing.
Does Kibi Scada also display CO₂ values?
Yes. Based on energy consumption, Kibi Scada calculates the associated CO₂ emissions per device, location, and time period, displaying them in the energy dashboard. The data can be exported as PDF and CSV—providing a solid foundation for sustainability goals and ESG reporting.
Which sensors are recommended?
For power sub-metering, Shelly modules based on Wi-Fi and Dragino modules based on LoRaWAN have proven effective. Where manufacturer devices offer an energy interface—such as modern combi steamers or dishwashers—consumption is read directly from the device.
See energy potential in real kitchen data?
We’ll show you live how Kibi Scada makes consumption data comparable—and turns it into actionable decisions for costs, operations, and sustainability.

Persönlicher Ansprechpartner
Christofer Wesseling
Founder & Managing Director · Weslink GmbH
We show Kibi Scada live on your equipment, advise you personally on integration and onboarding, and support the rollout in your operation.
Last updated: