
Reducing food waste in community catering: Where the biggest losses occur
Food waste rarely occurs at just one point. Usually, it adds up from planning errors, unclear feedback from locations, and missing data from production, distribution, and returns.
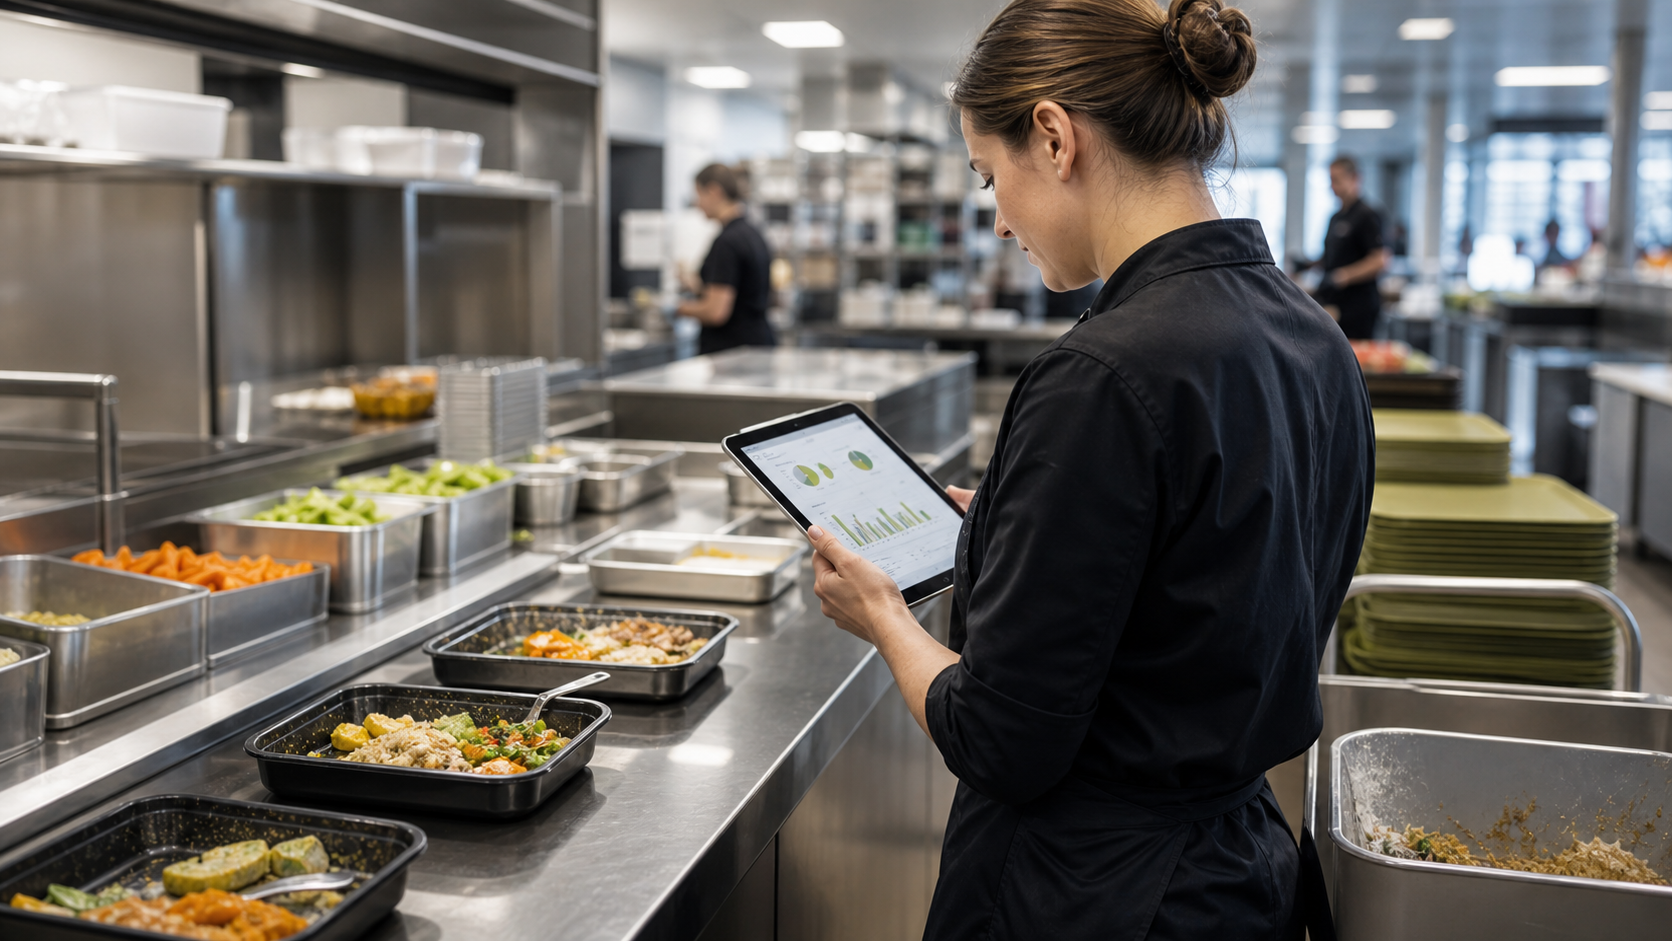

Why food waste is often a data problem
At first glance, food waste in communal catering appears to be a volume issue: too much was cooked, too much was served, or too much was left over. But a closer look reveals a different pattern. Losses rarely occur at a single point—they accumulate from planning assumptions that don’t match reality, unclear feedback from individual locations, and missing data between production, distribution, and returns.
As long as this information isn’t systematically recorded, identifying the root cause remains a matter of gut feeling. Kitchen management knows *something* was overproduced—but not reliably *where* the assumption went wrong. Was the number of participants overestimated? Was a dish unexpectedly unpopular? Or was part of a batch lost due to temperature deviations? Without reliable data, these questions are nearly impossible to answer precisely.
This is where the real leverage lies. To reduce food waste, you first need transparency about *where* and *how* losses occur. Only when each step becomes measurable can a vague impression be turned into a concrete, actionable measure. In many operations, food waste is less a behavioral issue than an information gap.
Measuring Food Waste Correctly: Production, Distribution, and Returns
Meaningful measurement starts with the understanding that food waste occurs at different stages and for different reasons. In practice, it has proven effective to consider at least three points separately: losses in production, leftovers at the serving counter, and what comes back via plate returns. If these quantities are lumped together, the crucial insight is lost—namely, where to actually apply leverage.
Production losses often point to volume planning, inventory management, or processing procedures. Serving leftovers indicate that more was prepared than demanded, perhaps because the buffet was meant to stay fully stocked until the end. Plate returns, in turn, provide clues about portion sizes and the actual acceptance of individual dishes. Each of these stages tells a different part of the story, and only together do they form a reliable picture.
Consistency in data collection across days and locations is key. One-off weighing campaigns deliver snapshots, not trends. Only continuous measurement reveals whether high returns were an outlier or a recurring pattern on specific days, for certain dishes, or at individual locations. This regularity is the foundation for any subsequent analysis.
These three areas often cause significant losses
In many large kitchens, recurring sources of waste can be narrowed down to three key areas. The first is advance quantity planning. When the expected number of guests differs from the actual number, overproduction or underproduction is almost inevitable. Fluctuating occupancy in hospitals, varying demand in staff restaurants, or last-minute cancellations in schools and cafeterias make reliable forecasts challenging.
The second area is the serving process itself. Here, the challenge lies in striking the right balance between an appealing, fully stocked offering and the quantity that is actually consumed. Especially during long serving hours or across multiple service lines, leftovers accumulate that can no longer be used. The question of how long each component can be held at what temperature also plays a role.
The third area involves storage, shelf life, and maintaining the cold chain. If temperatures in refrigeration units or during hot holding are not consistently kept within the correct range, quality losses can occur—or, in the worst case, entire batches may need to be discarded. These losses are particularly frustrating because they are often avoidable and only become apparent at a late stage.
Centralized capacity planning and scheduling as a key lever
Demand planning is the area where significant improvements can be made relatively early on. Planning involves making assumptions about the future—and these assumptions are only as good as the data they’re based on. In practice, procurement decisions often rely on the experience of individual employees. This works as long as those employees are available, but reaches its limits when locations expand, teams change, or multiple kitchens need to be coordinated centrally.
A systematic comparison of planning assumptions with actual consumption is helpful. When it’s documented how much of a dish was produced, served, and returned, forecasts can be refined step by step. Recurring patterns become visible: certain dishes are regularly overestimated, specific weekdays play out differently than expected, and individual locations systematically deviate from the average. This comparison creates a more reliable foundation than the memory of individual employees.
For businesses with multiple locations, comparability adds another layer. Only when all kitchens record data according to the same criteria can locations be meaningfully compared. A central overview of this data, as provided by a control center, turns many individual reports into a unified picture—making it easier for management to spot irregularities without having to call each kitchen individually.
The link between temperature deviations and production waste
Some food waste doesn’t stem from planning issues, but from maintaining cold and hot holding chains. In communal catering, temperature is a critical factor: if the permissible range is exceeded for too long, a batch can no longer be used for food safety reasons. Such incidents result in waste that could have been entirely avoided if the deviation had been detected early enough.
This directly relates to the HACCP concept. Continuous temperature monitoring at critical points primarily ensures food safety and documentation. The same data also helps reduce preventable losses. If a deviation is signaled in time, intervention is often still possible before goods are lost. Real-time alerts shift the response from retrospective detection to early corrective action.
Analyzing temperature data and waste quantities together reveals correlations that remain hidden in isolation. If losses accumulate at a specific device, in a particular cold storage room, or at certain times, this may indicate a technical defect, a process error, or an inefficient routine. This turns mere documentation into a basis for targeted improvements in equipment and workflows.
How digital data enables better decisions
Data isn’t an end in itself. Its value only emerges when it leads to traceable decisions. Continuously capturing production, output, returns, and temperatures digitally creates the foundation to not just suspect sources of loss, but to pinpoint them. A vague impression becomes a concrete observation—and from that observation, targeted action can be taken.
The typical path runs from reporting to adjustment. If an analysis shows that a particular dish is regularly returned in large quantities, portion sizes can be adjusted, the recipe revised, or the offering changed. If leftovers at a service line suggest overstocking, the replenishment quantity can be reduced toward the end of service. The key is ensuring every measure remains measurable, so its impact can be verified. This creates a cycle of measuring, evaluating, adjusting, and measuring again.
Platforms like Kibi Scada can support this cycle by consolidating measurements from different sources and locations into clear analyses. What matters isn’t the technology itself, but that the right people have a reliable basis for their decisions at the right time. Responsibility for action remains in the kitchen—the data simply provides the guidance.
Sustainability and Costs: The Argument for Management
Reducing food waste is not just a matter of sustainability—it’s also a business decision. Every discarded ingredient was purchased, stored, processed, and disposed of. Waste means lost resources: material costs, labor time, and energy, without generating any value in return. Those who minimize losses cut costs at multiple levels at once. This makes the issue highly relevant for management, which typically measures investments by their impact on the bottom line.
What convinces leadership is not a moral argument, but solid data. When it becomes clear where and how much is being lost—and which measures deliver what results—a vague concern becomes a manageable area. External perception also plays a role: verifiable responsible handling of food is increasingly a factor in tenders, for stakeholders, and in the competition for customers.
The link between sustainability and profitability isn’t a contradiction—it’s the strength of the topic. Measures that prevent waste usually save costs while also contributing to sustainability goals. A robust data foundation makes both effects visible, and thus easier to present as a compelling case to management.
Conclusion
Food waste in communal catering rarely occurs at a single point. It is the result of many small assumptions and gaps along the chain—from planning and production to serving and returns. To effectively reduce it, you should first measure where losses actually occur, rather than addressing symptoms.
Continuous digital tracking creates the necessary transparency, linking quantity and temperature data while revealing patterns across days and locations. This foundation enables targeted measures, whose impact can then be verified. What was once a vague problem becomes a manageable process—one that reduces costs and supports sustainability goals without relying on exaggerated promises.
Next step
Want to tackle this topic in your own operation?
We are happy to show you how temperature monitoring, HACCP documentation, reporting, food waste analysis or energy monitoring can be practically implemented in your kitchen structure.